Difference between revisions of "File:Spain Monthly-evolution-in-electricity-production 2019-2020 statisticalgraph 18576 eng.jpg"
(User created page with UploadWizard) (Tag: Upload Wizard) |
|||
| Line 1: | Line 1: | ||
=={{int:filedesc}}== | =={{int:filedesc}}== | ||
| − | {{ | + | Resource used for the creation of the National Atlas of Spain. |
| − | + | ||
| − | + | {{#set:Has resource ID=18576}} {{#set:Has time series ID=18576}} {{#set:Has alternate title 1=Spain. Monthly evolution in electricity production. 2019-2020. Statistical graph}} {{#set:Belongs to part=Productive sectors}} {{#set:Belongs to chapter=Mining, quarrying, energy, industry and construction}} {{#set:Belongs to topic=Energy}} {{#set:Has keyword=electricity production}} {{#set:Belongs to work=MC19_2021}} {{#set:Has temporal extent=2019 - 2020}} {{#set:When its temporal extent begins=2019}} {{#set:When its temporal extent ends=2020}} {{#set:When was last modified=2022-04-13}} {{#set:Has raw data published=0}} | |
| − | |||
| − | |||
| − | |||
| − | |||
| − | }} | ||
=={{int:license-header}}== | =={{int:license-header}}== | ||
Latest revision as of 06:37, 31 May 2022
Summary
Resource used for the creation of the National Atlas of Spain.
Licensing
CC BY 4.0 ign.es, 2021
See the list of members engaged
File history
Click on a date/time to view the file as it appeared at that time.
| Date/Time | Thumbnail | Dimensions | User | Comment | |
|---|---|---|---|---|---|
| current | 06:34, 31 May 2022 | 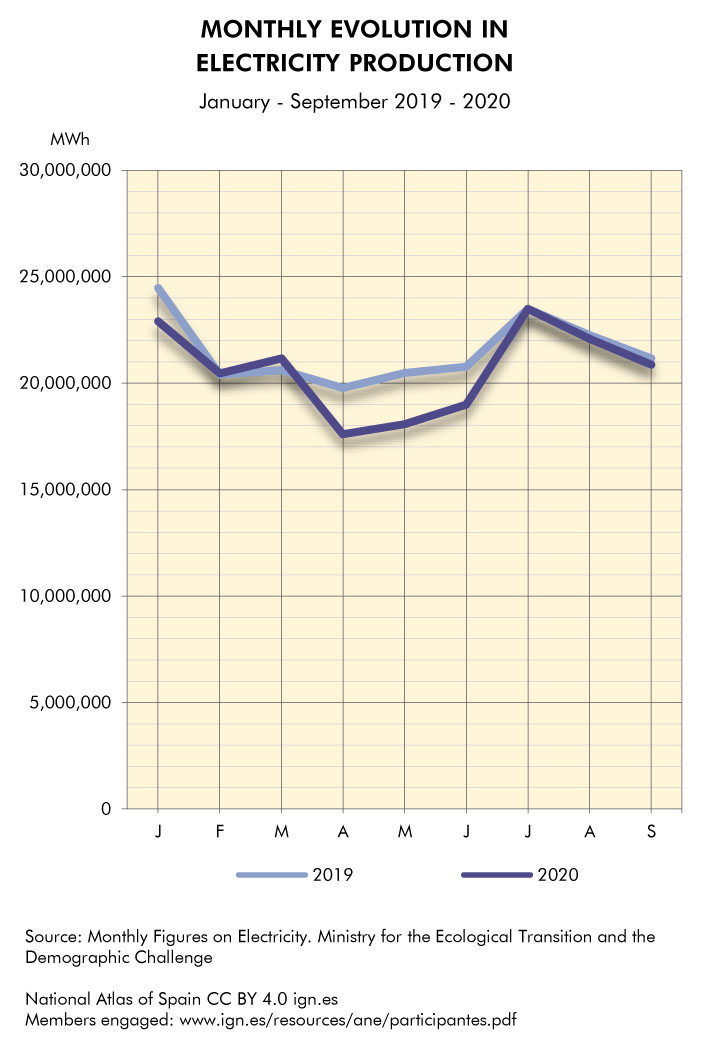 | 709 × 1,043 (103 KB) | Usr18 (talk | contribs) | User created page with UploadWizard |
- You cannot overwrite this file.
File usage
The following 3 pages link to this file: