Gallery of new files
This special page shows the last uploaded files.
 Milan Evolution-of-NO2-air-pollution-in-Milan 2019-2020 statisticalgraph 18598 eng.jpg Usr18
05:53, 31 May 2022
709 × 709; 120 KB
 London Evolution-of-NO2-air-pollution-in-London 2019-2020 statisticalgraph 18608 eng.jpg Usr18
05:53, 31 May 2022
709 × 709; 117 KB
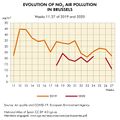 Brussels Evolution-of-NO2-air-pollution-in-Brussels 2019-2020 statisticalgraph 18607 eng.jpg Usr18
05:53, 31 May 2022
709 × 709; 116 KB
 Berlin Evolution-of-NO2-air-pollution-in-Berlin 2019-2020 statisticalgraph 18596 eng.jpg Usr18
05:53, 31 May 2022
709 × 709; 114 KB
 Athens Evolution-of-NO2-air-pollution-in-Athens 2019-2020 statisticalgraph 18606 eng.jpg Usr18
05:53, 31 May 2022
709 × 709; 119 KB
 Spain Noise-pollution-in-Madrid-during-lockdown 2019-2020 statisticalgraph 18617 eng.jpg Usr18
13:19, 30 May 2022
1,299 × 933; 206 KB
 Spain Monthly-variation-in-greenhouse-gas-emissions 2019-2020 statisticalgraph 18611 eng.jpg Usr18
13:19, 30 May 2022
709 × 709; 85 KB
 Spain Evolution-in-greenhouse-gas-emissions-by-sector 2000-2020 statisticalgraph 18610 eng.jpg Usr18
13:19, 30 May 2022
1,083 × 778; 107 KB
 Spain Evolution-in-greenhouse-gas-emissions-by-category 2018-2020 statisticalgraph 18612 eng.jpg Usr18
13:19, 30 May 2022
1,083 × 778; 162 KB
 Spain Evolution-in-greenhouse-gas-emissions-and-estimation-of-emissions-without-COVID--19 2018-2020 statisticalgraph 18613 eng.jpg Usr18
13:19, 30 May 2022
1,083 × 778; 164 KB
 Spain Evolution-in-CO2--equivalent-emissions-related-to-electricity-production 2018-2020 statisticalgraph 18605 eng.jpg Usr18
13:18, 30 May 2022
1,083 × 778; 154 KB
 Madrid Evolution-of-NO2-air-pollution-in-Madrid 2019-2020 statisticalgraph 18597 eng.jpg Usr18
13:18, 30 May 2022
709 × 709; 118 KB
 Lorca Evolution-in-seismic-noise-recorded-by-stations-from-the-National-Seismic-Network.-Lorca 2020 statisticalgraph 18626 eng.jpg Usr18
13:18, 30 May 2022
1,083 × 778; 217 KB
 Granada Evolution-in-seismic-noise-recorded-by-stations-from-the-National-Seismic-Network.-Granada 2020 statisticalgraph 18629 eng.jpg Usr18
13:18, 30 May 2022
1,083 × 778; 214 KB
 Barcelona Noise-levels-in-Barcelona-during-the-first-wave-of-the-pandemic 2019-2020 statisticalgraph 18615 eng.jpg Usr18
13:18, 30 May 2022
1,083 × 778; 126 KB
 Barcelona Noise-levels-due-to-nightlife-in-Barcelona-during-the-first-wave-of-the-pandemic 2019-2020 statisticalgraph 18623 eng.jpg Usr18
13:18, 30 May 2022
1,083 × 778; 143 KB
 Galicia Spotlights-propagation-COVID--19-in-the-town-of-Ourense 2020 map 17886 eng.jpg Usr17
12:50, 30 May 2022
654 × 730; 112 KB
 Galicia Spotlights-propagation-COVID--19-in-Santiago-de-Compostela 2020 map 17887 eng.jpg Usr17
12:50, 30 May 2022
654 × 730; 111 KB
 Galicia COVID--19-hotspots-in-Galicia 2020 map 17885 eng.jpg Usr17
12:50, 30 May 2022
933 × 685; 106 KB
 Galicia COVID--19-cases-in-the-municipality-of-Vigo 2020 map 17889 eng.jpg Usr17
12:50, 30 May 2022
874 × 588; 91 KB
 Galicia COVID--19-cases-in-the-municipality-of-A-Coruna 2020 map 17888 eng.jpg Usr17
12:50, 30 May 2022
874 × 783; 119 KB
 Galicia COVID--19-Cases-in-Galicia 2020 map 17884 eng.jpg Usr17
12:50, 30 May 2022
933 × 685; 128 KB
 Spain Key-map-to-the-areas-analysed 2020 map 18050 eng.jpg Usr17
12:27, 30 May 2022
709 × 525; 78 KB
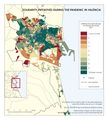 Valencia Solidarity-initiatives-during-the-pandemic.-Valencia 2020 map 18466 eng.jpg Usr20
11:34, 30 May 2022
709 × 779; 118 KB
 Spain Variation-in-the-assistance-provided-by-Caritas-during-the-first-wave-of-the-pandemic 2020 statisticalgraph 18479 eng.jpg Usr20
11:34, 30 May 2022
709 × 709; 91 KB
 Spain University-students-in-lockdown 2019-2020 map 17937 eng.jpg Usr20
11:34, 30 May 2022
933 × 685; 114 KB
 Spain Tweets-including-solidarity-hashtags-during-the-first-wave-of-the-pandemic 2020 map 18473 eng.jpg Usr20
11:33, 30 May 2022
709 × 526; 79 KB
 Spain Tax-revenue-for-the-public-treasury 2019-2020 map 18325 eng.jpg Usr20
11:33, 30 May 2022
933 × 685; 99 KB
 Spain Students-in-secondary-education--baccalaureate--vocational-training-and-special-scheme-in-lockdown 2019-2020 map 17936 eng.jpg Usr20
11:33, 30 May 2022
933 × 685; 149 KB
 Spain Students-in-infant-and-primary-education-in-lockdown 2019-2020 map 17935 eng.jpg Usr20
11:33, 30 May 2022
933 × 685; 129 KB
 Spain Solidarity-initiatives-during-the-pandemic-according-to-sphere-of-action 2020 statisticalgraph 18549 eng.jpg Usr20
11:33, 30 May 2022
1,456 × 620; 90 KB
 Spain Revenue-from-Value-Added-Tax-(VAT 2019-2020 map 18326 eng.jpg Usr20
11:33, 30 May 2022
709 × 526; 72 KB
 Spain Revenue-from-Personal-Income-Tax-(PIT) 2019-2020 map 18327 eng.jpg Usr20
11:33, 30 May 2022
709 × 526; 74 KB
 Spain Revenue-from-Corporate-Income-Tax-(CIT) 2019-2020 map 18328 eng.jpg Usr20
11:33, 30 May 2022
709 × 526; 81 KB
 Spain Requests-for-assistance-from-Caritas-during-the-first-wave-of-the-pandemic 2020 statisticalgraph 18478 eng.jpg Usr20
11:33, 30 May 2022
709 × 709; 95 KB
 Spain Public-expenditure-of-the-regional-administrations-per-capita 2020 map 18390 eng.jpg Usr20
11:33, 30 May 2022
709 × 526; 64 KB
 Spain Public-expenditure-of-the-Regional-Administrations 2019-2020 map 18389 eng.jpg Usr20
11:33, 30 May 2022
933 × 685; 117 KB
 Spain Public-Expenditure-of-the-National-Administration 2019-2020 map 18387 eng.jpg Usr20
11:33, 30 May 2022
933 × 685; 122 KB
 Spain People-assisted-by-the-Spanish-Red-Cross-during-the-first-wave-of-the-pandemic 2020 statisticalgraph 18476 eng.jpg Usr20
11:33, 30 May 2022
709 × 709; 90 KB
 Spain Main-food-products-dispensed-by-the-Spanish-Federation-of-Food-Banks 2019-2020 statisticalgraph 18550 eng.jpg Usr20
11:33, 30 May 2022
709 × 709; 87 KB
 Spain Evolution-in-the-public-expenditure-of-the-National-Administration 2015-2020 statisticalgraph 18388 eng.jpg Usr20
11:33, 30 May 2022
1,299 × 933; 159 KB
 Spain Evolution-in-the-amount-of-tweets-including-solidarity-hashtags-published-during-the-first-wave-of-the-pandemic 2020 statisticalgraph 18469 eng.jpg Usr20
11:33, 30 May 2022
1,456 × 1,043; 174 KB
 Spain Evolution-in-tax-revenue-for-the-Public-Treasury 2010-2020 statisticalgraph 18334 eng.jpg Usr20
11:33, 30 May 2022
1,457 × 778; 138 KB
 Spain Evolution-in-revenue-from-Value-Added-Tax-(VAT) 2010-2020 statisticalgraph 18335 eng.jpg Usr20
11:33, 30 May 2022
1,083 × 778; 142 KB
 Spain Evolution-in-revenue-from-Personal-Income-Tax-(PIT) 2010-2020 statisticalgraph 18336 eng.jpg Usr20
11:33, 30 May 2022
1,299 × 933; 162 KB
 Spain Evolution-in-revenue-from-Corporate-Income-Tax-(CIT 2010-2020 statisticalgraph 18337 eng.jpg Usr20
11:33, 30 May 2022
1,299 × 933; 164 KB
 Spain Cumulative-public-debt-of-the-regional-administrations 2008-2020 map 18391 eng.jpg Usr20
11:33, 30 May 2022
933 × 685; 98 KB
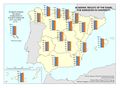 Spain Academic-results-of-the-exams-for-admissions-in-university 2019-2020 map 18222 eng.jpg Usr20
11:33, 30 May 2022
933 × 685; 108 KB


_2019-2020_map_18327_eng.jpg)
_2019-2020_map_18328_eng.jpg)


_2010-2020_statisticalgraph_18335_eng.jpg)
_2010-2020_statisticalgraph_18336_eng.jpg)


