Most linked-to files
Showing below up to 50 results in range #1 to #50.
View (previous 50 | next 50) (20 | 50 | 100 | 250 | 500)


 Barcelona Incidence-of-COVID--19-and-socioeconomic-conditions.-Metropolitan-Area-of-Barcelona 2020 map 17942 eng.jpg Used on 4 pages
933 × 946; 173 KB
 Barcelona Incidence-of-COVID--19-in-relation-to-social-vulnerability-and-income 2020 statisticalgraph 17945 eng.jpg Used on 4 pages
689 × 1,033; 99 KB
 Barcelona Mobility-on-public-rail-transport.-City-of-Barcelona 2020 map 17992 eng.jpg Used on 4 pages
933 × 685; 121 KB
 Barcelona Mobility-on-public-rail-transport.-Metropolitan-Area-of-Barcelona 2020 map 17991 eng.jpg Used on 4 pages
933 × 946; 162 KB

 Barcelona Mobility-on-public-transport-in-relation-to-personal-income.-Metropolitan-Area-of-Barcelona 2020 statisticalgraph 18018 eng.jpg Used on 4 pages
1,083 × 640; 177 KB
 Barcelona Incidence-of-COVID--19-and-income.-City-of-Barcelona 2020 map 17943 eng.jpg Used on 4 pages
933 × 685; 111 KB
 Logrono Evolution-in-the-average-daily-temperature-in-February-in-Logrono-(airport) 1981-2020 statisticalgraph 18410 eng.jpg Used on 3 pages
709 × 709; 120 KB
 Spain Fall-in-intra--provincial-mobility.-Downscaling-process-–-week-1 2020 map 18244 eng.jpg Used on 3 pages
709 × 526; 76 KB

 Spain Monthly-evolution-in-registered-unemployed-in-sales--services-and-trade-during-the-pandemic 2019-2020 map 18529 eng.jpg Used on 3 pages
709 × 526; 77 KB
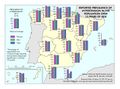 Spain Reported-prevalence-of-hypertension-in-the-population-over-15-years-of-age 2017 map 17862 eng.jpg Used on 3 pages
709 × 526; 85 KB

 Spain Trends-in-wasterwater-pollution-by-SARS--COV--2 2020 map 18589 eng.jpg Used on 3 pages
1,388 × 1,016; 188 KB
 Spain Evolution-in-acceptances-of-inheritance-deeds-during-the-pandemic 2019-2020 statisticalgraph 18536 eng.jpg Used on 3 pages
850 × 850; 120 KB
 World Evolution-of-COVID--19-cases-in-most-affected-countries 2020 statisticalgraph 17719 eng.jpg Used on 3 pages
1,083 × 778; 163 KB
 Spain Evolution-in-the-average-daily-traffic-flow-(ADTF)-Toledo 2019-2020 statisticalgraph 18437 eng.jpg Used on 3 pages
1,299 × 1,252; 291 KB
 Europe Deaths-from-COVID--19-in-the-European-Union 2020 map 17793 eng.jpg Used on 3 pages
1,388 × 1,016; 176 KB
 Spain Evolution-in-the-number-of-interventions-under-Operation-Balmis 2020 statisticalgraph 18516 eng.jpg Used on 3 pages
1,457 × 689; 116 KB
 Spain Evolution-of-e--commerce-turnover-during-the-pandemic 2019-2020 statisticalgraph 18534 eng.jpg Used on 3 pages
1,299 × 933; 138 KB
 Madrid Synthetic-vulnerability-index.-City-of-Madrid 2017 map 18012 eng.jpg Used on 3 pages
1,388 × 1,016; 179 KB
 Spain Female-beneficiaries-of-Active-Insertion-Income-by-group 2020 statisticalgraph 18571 eng.jpg Used on 3 pages
709 × 679; 94 KB
 Saragossa Variation-in-home-office-during-lockdown.-City-of-Zaragoza 2020 map 18153 eng.jpg Used on 3 pages
650 × 467; 90 KB
 Spain Beneficiaries-of-the-Active-Insertion-Income-by-age 2020 map 18567 eng.jpg Used on 3 pages
933 × 685; 131 KB


 Spain Variation-in-the-assistance-provided-by-Caritas-during-the-first-wave-of-the-pandemic 2020 statisticalgraph 18479 eng.jpg Used on 3 pages
709 × 709; 91 KB
 Spain Evolution-in-registered-unemployment 2015-2020 statisticalgraph 17839 eng.jpg Used on 3 pages
1,456 × 1,043; 144 KB
 Spain Evolution-in-the-average-daily-traffic-flow-(ADTF).-Saragossa 2019-2020 statisticalgraph 18440 eng.jpg Used on 3 pages
1,299 × 1,252; 289 KB
 Milan Evolution-of-NO2-air-pollution-in-Milan 2019-2020 statisticalgraph 18598 eng.jpg Used on 3 pages
709 × 709; 120 KB
 Spain Hospital-admissions-due-to-COVID--19-during-the-downward-phase-of-the-pandemic 2020 map 18036 eng.jpg Used on 3 pages
709 × 526; 99 KB
 Spain Messages-on-twitter-in-solidarity-with-the-provisional-Hospital-at-Madrid-Trade-Fair 2020 statisticalgraph 18518 eng.jpg Used on 3 pages
1,083 × 778; 171 KB
 Spain Noise-pollution-in-Madrid-during-lockdown 2019-2020 statisticalgraph 18617 eng.jpg Used on 3 pages
1,299 × 933; 206 KB
 Spain COVID--19-cases-during-the-first-wave-of-the-pandemic 2020 map 18072 eng.jpg Used on 3 pages
709 × 526; 100 KB
 Spain Deaths-from-COVID--19-during-the-first-wave-of-the-pandemic 2020 map 18074 eng.jpg Used on 3 pages
709 × 526; 93 KB
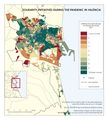 Valencia Solidarity-initiatives-during-the-pandemic.-Valencia 2020 map 18466 eng.jpg Used on 3 pages
709 × 779; 118 KB
 Spain Evolution-in-the-amount-of-households-with-no-income 2005-2020 statisticalgraph 17864 eng.jpg Used on 3 pages
1,299 × 933; 174 KB
 Bilbao Evolution-in-the-average-daily-temperature-in-February-in-Bilbao-(airport) 1981-2020 statisticalgraph 18408 eng.jpg Used on 3 pages
709 × 709; 122 KB
 Spain Evolution-in-the-number-of-Social-Service-Sector-Conferences 2009-2020 statisticalgraph 18524 eng.jpg Used on 3 pages
1,083 × 778; 126 KB
 Granada Evolution-in-seismic-noise-recorded-by-stations-from-the-National-Seismic-Network.-Granada 2020 statisticalgraph 18629 eng.jpg Used on 3 pages
1,083 × 778; 214 KB
 London Evolution-of-NO2-air-pollution-in-London 2019-2020 statisticalgraph 18608 eng.jpg Used on 3 pages
709 × 709; 117 KB


_1981-2020_statisticalgraph_18410_eng.jpg)


-Toledo_2019-2020_statisticalgraph_18437_eng.jpg)


.-Saragossa_2019-2020_statisticalgraph_18440_eng.jpg)


_1981-2020_statisticalgraph_18408_eng.jpg)


