Most linked-to files
Showing below up to 50 results in range #51 to #100.
View (previous 50 | next 50) (20 | 50 | 100 | 250 | 500)
 Spain Evolution-in-natural-gas-consumption 2019-2020 map 18581 eng.jpg Used on 3 pages
933 × 685; 100 KB
 Spain Evolution-in-the-average-daily-traffic-flow-(ADTF).-Cantabria 2019-2020 statisticalgraph 18435 eng.jpg Used on 3 pages
1,299 × 1,252; 293 KB
 Europe Main-airports-in-the-European-Union 2019 map 17850 eng.jpg Used on 3 pages
933 × 1,016; 205 KB
 Spain Evolution-in-the-use-of-hospital-beds-by-COVID--19-patients-during-the-first-wave-of-the-pandemic 2020 statisticalgraph 18354 eng.jpg Used on 3 pages
1,083 × 778; 124 KB
 Spain Evolution-of-total-public-spending-by-the-regional-administrations 2012-2019 map 18538 eng.jpg Used on 3 pages
933 × 685; 117 KB

 Spain GENERAL-DETAILS-OF-THE-BALMIS-OPERATION 2020 illustration 18554 eng.jpg Used on 3 pages
1,723 × 821; 188 KB
 Seville Solidarity-initiatives-during-the-pandemic.-Seville 2020 map 18465 eng.jpg Used on 3 pages
933 × 685; 111 KB
 Spain Monthly-evolution-of-hotel-occupancy-during-the-pandemic 2019-2020 map 18232 eng.jpg Used on 3 pages
933 × 685; 120 KB
 Spain Main-food-products-dispensed-by-the-Spanish-Federation-of-Food-Banks 2019-2020 statisticalgraph 18550 eng.jpg Used on 3 pages
709 × 709; 87 KB
 Spain Benefits-from-the-National-Minimum-Subsistence-Income-by-household-in-poverty 2020 map 18208 eng.jpg Used on 3 pages
709 × 526; 68 KB
 Spain Processed-applications-for-the-Minimum-Subsistance-Income 2020-2021 map 18560 eng.jpg Used on 3 pages
933 × 685; 148 KB
 Spain Coverage-of-unemployment-benefits 2019-2020 map 17871 eng.jpg Used on 3 pages
933 × 685; 122 KB
 Spain Weekly-evolution-in-food-prices-during-the-pandemic 2019-2020 statisticalgraph 18369 eng.jpg Used on 3 pages
1,299 × 933; 193 KB
 Barcelona Noise-levels-in-Barcelona-during-the-first-wave-of-the-pandemic 2019-2020 statisticalgraph 18615 eng.jpg Used on 3 pages
1,083 × 778; 126 KB
 Spain Evolution-in-the-industrial-production-index 2018-2020 statisticalgraph 17801 eng.jpg Used on 3 pages
1,299 × 933; 219 KB
 Galicia Spotlights-propagation-COVID--19-in-Santiago-de-Compostela 2020 map 17887 eng.jpg Used on 3 pages
654 × 730; 111 KB
 Spain Fall-in-inter--provincial-mobility.-Lockdown-–-week-2. 2020 map 18249 eng.jpg Used on 3 pages
709 × 526; 76 KB
 Palma Evolution-in-the-average-daily-temperature-in-February-in-Palma-(port) 1981-2020 statisticalgraph 18409 eng.jpg Used on 3 pages
709 × 709; 124 KB
 Spain Hospitals-according-to-the-purpose-of-care 2019 map 18360 eng.jpg Used on 3 pages
933 × 685; 124 KB
 Spain Passengers-on-metropolitan-railway-services 2019-2020 map 17709 eng.jpg Used on 3 pages
933 × 685; 108 KB
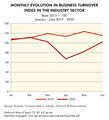 Spain Monthly-evolution-in-Business-Turnover-Index-in-the-industry-sector 2019-2020 statisticalgraph 18488 eng.jpg Used on 3 pages
850 × 932; 107 KB
 Spain Registered-unemployment-by-economic-sector 2018-2019 map 17843 eng.jpg Used on 3 pages
933 × 685; 126 KB

 Spain Estimated-youth-unemployment-during-the-first-wave-of-the-pandemic 2020 map 17848 eng.jpg Used on 3 pages
709 × 526; 88 KB
 Warsaw Evolution-of-NO2-air-pollution-in-Warsaw 2019-2020 statisticalgraph 18601 eng.jpg Used on 3 pages
709 × 709; 119 KB
 Canary-Islands Maritime-passenger-traffic.-Canary-Islands 2019-2020 map 17817 eng.jpg Used on 3 pages
933 × 685; 74 KB
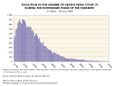 Spain Evolution-in-the-number-of-deaths-from-Covid--19-during-the-downward-phase-of-the-pandemic 2020 statisticalgraph 18032 eng.jpg Used on 3 pages
1,083 × 778; 160 KB
 Spain Fall-in-intra--provincial-mobility.-Lockdown-–-weeks-5-and-6 2020 map 18243 eng.jpg Used on 3 pages
709 × 526; 75 KB
 Saragossa COVID--19-frequentation-rate.-City-of-Zaragoza 2020 map 18151 eng.jpg Used on 3 pages
1,330 × 958; 207 KB

 Spain Companies-using-furlough-schemes-according-to-economic-sector 2020 statisticalgraph 17876 eng.jpg Used on 3 pages
1,654 × 1,252; 191 KB

 Spain Evolution-in-petrol-and-diesel-consumption 2019-2020 map 18580 eng.jpg Used on 3 pages
933 × 685; 96 KB
 Balearic-Islands Maritime-passenger-traffic.-Balearic-Islands 2019-2020 map 17818 eng.jpg Used on 3 pages
933 × 685; 65 KB
 Spain Evolution-in-the-average-daily-traffic-flow-(ADTF).-Corunna 2019-2020 statisticalgraph 18429 eng.jpg Used on 3 pages
1,299 × 1,252; 276 KB
 Europe Most-populous-cities-in-the-European-Union 2019 map 18141 eng.jpg Used on 3 pages
933 × 1,016; 208 KB
 Spain Evolution-of-COVID--19-cases-during-the-downward-phase-of-the-pandemic 2020 statisticalgraph 17735 eng.jpg Used on 3 pages
1,083 × 778; 159 KB
 Malaga Transmission-hazard.-Percentage-of-Covid--19-cases 2020 map 17732 eng.jpg Used on 3 pages
874 × 618; 155 KB
 Spain Geographical-footprint-of-the-Armed-Forces-under-Operation-Balmis 2020 map 18380 eng.jpg Used on 3 pages
1,388 × 1,016; 351 KB
 Seville Variation-in-the-vegetation-index-in-the-city-of-Seville-during-the-first-wave-of-the-pandemic 2017-2020 map 18583 eng.jpg Used on 3 pages
1,329 × 990; 459 KB
 Spain Monthly-evolution-of-meat-production-during-the-pandemic 2019-2020 statisticalgraph 18346 eng.jpg Used on 3 pages
1,299 × 826; 153 KB

.-Cantabria_2019-2020_statisticalgraph_18435_eng.jpg)


_1981-2020_statisticalgraph_18409_eng.jpg)


.-Corunna_2019-2020_statisticalgraph_18429_eng.jpg)


