Most linked-to files
Showing below up to 50 results in range #1 to #50.
View (previous 50 | next 50) (20 | 50 | 100 | 250 | 500)


 Barcelona Incidence-of-COVID--19-and-income.-City-of-Barcelona 2020 map 17943 eng.jpg Used on 4 pages
933 × 685; 111 KB
 Barcelona Incidence-of-COVID--19-and-socioeconomic-conditions.-Metropolitan-Area-of-Barcelona 2020 map 17942 eng.jpg Used on 4 pages
933 × 946; 173 KB
 Barcelona Incidence-of-COVID--19-in-relation-to-social-vulnerability-and-income 2020 statisticalgraph 17945 eng.jpg Used on 4 pages
689 × 1,033; 99 KB
 Barcelona Mobility-on-public-rail-transport.-City-of-Barcelona 2020 map 17992 eng.jpg Used on 4 pages
933 × 685; 121 KB
 Barcelona Mobility-on-public-rail-transport.-Metropolitan-Area-of-Barcelona 2020 map 17991 eng.jpg Used on 4 pages
933 × 946; 162 KB

 Barcelona Mobility-on-public-transport-in-relation-to-personal-income.-Metropolitan-Area-of-Barcelona 2020 statisticalgraph 18018 eng.jpg Used on 4 pages
1,083 × 640; 177 KB
 Spain Investment-in-Regional-Minimum-Income-policies 2020 map 18565 eng.jpg Used on 3 pages
709 × 526; 73 KB

 Spain Students-in-secondary-education--baccalaureate--vocational-training-and-special-scheme-in-lockdown 2019-2020 map 17936 eng.jpg Used on 3 pages
933 × 685; 149 KB
 Spain Companies-registered-in-the-Social-Security-System-by-economic-sector 2019-2020 map 17972 eng.jpg Used on 3 pages
933 × 685; 119 KB
 Spain Workers-affiliated-to-the-Social-Security-system-during-the-first-wave-of-the-pandemic 2019-2020 map 17824 eng.jpg Used on 3 pages
1,388 × 1,016; 202 KB
 Spain Evolution-in-natural-gas-consumption 2019-2020 map 18581 eng.jpg Used on 3 pages
933 × 685; 100 KB
 Spain Evolution-in-the-average-daily-traffic-flow-(ADTF).-Cantabria 2019-2020 statisticalgraph 18435 eng.jpg Used on 3 pages
1,299 × 1,252; 293 KB
 Europe Main-airports-in-the-European-Union 2019 map 17850 eng.jpg Used on 3 pages
933 × 1,016; 205 KB
 Spain Evolution-in-the-use-of-hospital-beds-by-COVID--19-patients-during-the-first-wave-of-the-pandemic 2020 statisticalgraph 18354 eng.jpg Used on 3 pages
1,083 × 778; 124 KB
 Madrid Evolution-of-NO2-air-pollution-in-Madrid 2019-2020 statisticalgraph 18597 eng.jpg Used on 3 pages
709 × 709; 118 KB
 Spain Monthly-variation-in-greenhouse-gas-emissions 2019-2020 statisticalgraph 18611 eng.jpg Used on 3 pages
709 × 709; 85 KB
 Spain Fall-in-intra--provincial-mobility.-Lockdown-–-week-4 2020 map 18242 eng.jpg Used on 3 pages
709 × 526; 66 KB
 Spain Public-expenditure-of-the-Regional-Administrations 2019-2020 map 18389 eng.jpg Used on 3 pages
933 × 685; 117 KB
 Spain Main-food-products-dispensed-by-the-Spanish-Federation-of-Food-Banks 2019-2020 statisticalgraph 18550 eng.jpg Used on 3 pages
709 × 709; 87 KB
 Spain Benefits-from-the-National-Minimum-Subsistence-Income-by-household-in-poverty 2020 map 18208 eng.jpg Used on 3 pages
709 × 526; 68 KB
 Spain Coverage-of-unemployment-benefits 2019-2020 map 17871 eng.jpg Used on 3 pages
933 × 685; 122 KB
 Barcelona Noise-levels-in-Barcelona-during-the-first-wave-of-the-pandemic 2019-2020 statisticalgraph 18615 eng.jpg Used on 3 pages
1,083 × 778; 126 KB
 Spain Evolution-in-the-industrial-production-index 2018-2020 statisticalgraph 17801 eng.jpg Used on 3 pages
1,299 × 933; 219 KB
 Galicia Spotlights-propagation-COVID--19-in-Santiago-de-Compostela 2020 map 17887 eng.jpg Used on 3 pages
654 × 730; 111 KB
 Spain Evolution-of-total-public-spending-by-the-regional-administrations 2012-2019 map 18538 eng.jpg Used on 3 pages
933 × 685; 117 KB

 Spain Passengers-using-rail-transport 2019-2020 map 17780 eng.jpg Used on 3 pages
1,388 × 1,016; 195 KB
 Spain GENERAL-DETAILS-OF-THE-BALMIS-OPERATION 2020 illustration 18554 eng.jpg Used on 3 pages
1,723 × 821; 188 KB
 Seville Solidarity-initiatives-during-the-pandemic.-Seville 2020 map 18465 eng.jpg Used on 3 pages
933 × 685; 111 KB
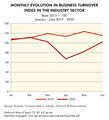 Spain Monthly-evolution-in-Business-Turnover-Index-in-the-industry-sector 2019-2020 statisticalgraph 18488 eng.jpg Used on 3 pages
850 × 932; 107 KB


 Spain Estimated-youth-unemployment-during-the-first-wave-of-the-pandemic 2020 map 17848 eng.jpg Used on 3 pages
709 × 526; 88 KB
 Canary-Islands Maritime-passenger-traffic.-Canary-Islands 2019-2020 map 17817 eng.jpg Used on 3 pages
933 × 685; 74 KB
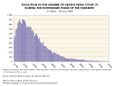 Spain Evolution-in-the-number-of-deaths-from-Covid--19-during-the-downward-phase-of-the-pandemic 2020 statisticalgraph 18032 eng.jpg Used on 3 pages
1,083 × 778; 160 KB


.-Cantabria_2019-2020_statisticalgraph_18435_eng.jpg)


