Most linked-to files
Showing below up to 50 results in range #101 to #150.
View (previous 50 | next 50) (20 | 50 | 100 | 250 | 500)
 Spain Fall-in-intra--provincial-mobility.-Lockdown-–-week-2 2020 map 18240 eng.jpg Used on 3 pages
709 × 526; 74 KB
 Seville Evolution-in-water-consumption-by-the-industry-in-the-city-of-Seville 2019-2020 statisticalgraph 18619 eng.jpg Used on 3 pages
1,083 × 778; 112 KB
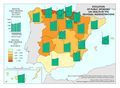
 Spain Beneficiaries-of-the-Regional-Minimum-Income 2020 map 18563 eng.jpg Used on 3 pages
709 × 526; 80 KB
 Spain Evolution-in-sales-index-and-occupancy-rate-in-retail-trade 2019-2020 statisticalgraph 18588 eng.jpg Used on 3 pages
1,298 × 850; 161 KB
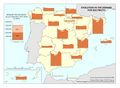 Spain Evolution-in-the-demand-for-electricity 2019-2020 map 18621 eng.jpg Used on 3 pages
933 × 685; 97 KB
 Galicia COVID--19-cases-in-the-municipality-of-Vigo 2020 map 17889 eng.jpg Used on 3 pages
874 × 588; 91 KB
 Valladolid Monthly-evolution-in-ultraviolet-radiation-in-Valladolid 2019-2020 statisticalgraph 18421 eng.jpg Used on 3 pages
1,082 × 728; 176 KB
 Spain Evolution-of-public-spending-on-health-by-the-regional-administrations 2012-2019 map 18539 eng.jpg Used on 3 pages
933 × 685; 125 KB
 Malaga Infection-hazard.-Number-of-Covid--19-cases 2020 map 17731 eng.jpg Used on 3 pages
874 × 618; 123 KB

 Spain Deaths-from-COVID--19-over-80-years-of-age-during-the-rising-phase-of-the-pandemic 2020 map 17984 eng.jpg Used on 3 pages
709 × 526; 94 KB
 Spain Population-leaving-their-mobility-area-during-the-first-wave-of-the-pandemic 2020 statisticalgraph 18256 eng.jpg Used on 3 pages
1,457 × 778; 145 KB
 Spain Estimated-unemployment-by-sex-during-the-fisrt-wave-of-the-pandemic 2020 map 17846 eng.jpg Used on 3 pages
709 × 526; 87 KB
 Spain Revenue-from-Corporate-Income-Tax-(CIT) 2019-2020 map 18328 eng.jpg Used on 3 pages
709 × 526; 81 KB
 Spain Tweets-including-solidarity-hashtags-during-the-pandemic.-Lockdown-–-week-1 2020 map 18470 eng.jpg Used on 3 pages
709 × 526; 73 KB
 Spain Evolution-in-the-number-of-deaths-from-COVID--19-during-the-first-wave-of-the-pandemic 2020 statisticalgraph 18081 eng.jpg Used on 3 pages
1,083 × 778; 213 KB

 Spain Fall-in-inter--provincial-mobility.-Downscaling-scheme-–-week-6 2020 map 18255 eng.jpg Used on 3 pages
709 × 526; 79 KB
 North-Atlantic Upper-air-chart-before-the-pandemic 2020 map 18383 eng.jpg Used on 3 pages
709 × 525; 115 KB


 Spain Companies-registered-in-Social-Security-System-during-the-pandemic 2020 map 17973 eng.jpg Used on 3 pages
933 × 685; 95 KB


 Spain Evolution-in-greenhouse-gas-emissions-by-sector 2000-2020 statisticalgraph 18610 eng.jpg Used on 3 pages
1,083 × 778; 107 KB
 Spain Solidarity-initiatives-during-the-pandemic-according-to-sphere-of-action 2020 statisticalgraph 18549 eng.jpg Used on 3 pages
1,456 × 620; 90 KB
 Spain Evolution-in-the-average-daily-traffic-flow-(ADTF).-Burgos 2019-2020 statisticalgraph 18428 eng.jpg Used on 3 pages
1,299 × 1,252; 291 KB
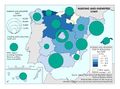
 Europe Healthcare-workers-in-the-European-Union 2018 map 17875 eng.jpg Used on 3 pages
1,388 × 1,016; 187 KB
 Spain Evolution-in-the-use-of-hospital-beds-by-COVID--19-patients-during-the-first-wave-of-the-pandemic 2020 map 18353 eng.jpg Used on 3 pages
709 × 526; 79 KB
 Madrid Evolution-in-the-average-daily-temperature-in-February-in-Madrid-(Retiro) 1981-2020 statisticalgraph 18407 eng.jpg Used on 3 pages
709 × 709; 126 KB
 Spain Fall-in-intra--provincial-mobility.-Lockdown-–-week-3 2020 map 18241 eng.jpg Used on 3 pages
709 × 526; 73 KB

 Seville Image-of-the-city-of-Seville-from-the-National-Aerial-Orthophotography-Plan-(PNOA) 2019 image 18584 eng.jpg Used on 3 pages
1,828 × 1,446; 914 KB
 Spain Beneficiaries-of-unemployment-benefits 2019-2020 map 17873 eng.jpg Used on 3 pages
933 × 685; 119 KB
 Spain Container-traffic-according-to-type-of-shipping 2019-2020 map 17699 eng.jpg Used on 3 pages
933 × 685; 110 KB

 Spain Evolution-in-tax-revenue-for-the-Public-Treasury 2010-2020 statisticalgraph 18334 eng.jpg Used on 3 pages
1,457 × 778; 138 KB
 Barcelona Noise-levels-due-to-nightlife-in-Barcelona-during-the-first-wave-of-the-pandemic 2019-2020 statisticalgraph 18623 eng.jpg Used on 3 pages
1,083 × 778; 143 KB
 Spain Evolution-in-the-demand-for-electricity 2019-2020 statisticalgraph 18622 eng.jpg Used on 3 pages
689 × 1,043; 107 KB

 Spain Evolution-of-public-spending-on-social-protection-by-the-regional-administrations 2012-2019 map 18540 eng.jpg Used on 3 pages
933 × 685; 105 KB


_2019-2020_map_18328_eng.jpg)


.-Burgos_2019-2020_statisticalgraph_18428_eng.jpg)


_1981-2020_statisticalgraph_18407_eng.jpg)


_2019_image_18584_eng.jpg)


