Most linked-to files
Showing below up to 50 results in range #1 to #50.
View (previous 50 | next 50) (20 | 50 | 100 | 250 | 500)


 Barcelona Mobility-on-public-rail-transport.-City-of-Barcelona 2020 map 17992 eng.jpg Used on 4 pages
933 × 685; 121 KB
 Barcelona Mobility-on-public-rail-transport.-Metropolitan-Area-of-Barcelona 2020 map 17991 eng.jpg Used on 4 pages
933 × 946; 162 KB

 Barcelona Mobility-on-public-transport-in-relation-to-personal-income.-Metropolitan-Area-of-Barcelona 2020 statisticalgraph 18018 eng.jpg Used on 4 pages
1,083 × 640; 177 KB
 Barcelona Incidence-of-COVID--19-and-income.-City-of-Barcelona 2020 map 17943 eng.jpg Used on 4 pages
933 × 685; 111 KB
 Barcelona Incidence-of-COVID--19-and-socioeconomic-conditions.-Metropolitan-Area-of-Barcelona 2020 map 17942 eng.jpg Used on 4 pages
933 × 946; 173 KB
 Barcelona Incidence-of-COVID--19-in-relation-to-social-vulnerability-and-income 2020 statisticalgraph 17945 eng.jpg Used on 4 pages
689 × 1,033; 99 KB
 Spain Evolution-in-the-average-daily-traffic-flow-(ADTF).-Asturias 2019-2020 statisticalgraph 18434 eng.jpg Used on 3 pages
1,299 × 1,252; 285 KB
 Europe Evolution-in-the-number-of-deaths-from-Covid--19-in-the-European-Union 2020 statisticalgraph 17796 eng.jpg Used on 3 pages
1,299 × 933; 176 KB
 Spain Evolution-in-the-number-of-trips-during-the-first-wave-of-the-pandemic 2020 statisticalgraph 18367 eng.jpg Used on 3 pages
1,457 × 778; 207 KB
 Lorca Evolution-in-seismic-noise-recorded-by-stations-from-the-National-Seismic-Network.-Lorca 2020 statisticalgraph 18626 eng.jpg Used on 3 pages
1,083 × 778; 217 KB
 Spain Fall-in-intra--provincial-mobility.-Downscaling-process-–-week-6 2020 map 18246 eng.jpg Used on 3 pages
709 × 526; 73 KB


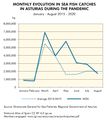 Spain Monthly-evolution-in-sea-fish-catches-in-Asturias-during-the-pandemic 2015-2020 statisticalgraph 18331 eng.jpg Used on 3 pages
850 × 932; 124 KB


 Spain Evolution-in-executions-to-grant-general-powers-of-attorney-during-the-pandemic 2019-2020 statisticalgraph 18537 eng.jpg Used on 3 pages
850 × 850; 129 KB
 Spain Evolution-in-revenue-from-Personal-Income-Tax-(PIT) 2010-2020 statisticalgraph 18336 eng.jpg Used on 3 pages
1,299 × 933; 162 KB
 Spain Evolution-in-the-average-daily-traffic-flow-(ADTF).-Valencia 2019-2020 statisticalgraph 18438 eng.jpg Used on 3 pages
1,299 × 1,252; 287 KB

 Spain Evolution-of-hospital-admissions-due-to-Covid--19--during-the-downward-phase-of-the-pandemic 2020 statisticalgraph 18033 eng.jpg Used on 3 pages
1,083 × 778; 132 KB
 Madrid Variation-in-noise-levels-in-Madrid-during-lockdown 2019-2020 map 18614 eng.jpg Used on 3 pages
709 × 756; 107 KB
 Spain Population-living-in-scattered-villages-by-municipality 2020 map 18026 eng.jpg Used on 3 pages
1,388 × 1,016; 264 KB

 Seville Daily-variation-in-the-water-supplied-in-Seville-during-the-first-wave-of-the-pandemic 2019-2020 statisticalgraph 18620 eng.jpg Used on 3 pages
2,215 × 778; 239 KB
 Spain Revenue-from-Personal-Income-Tax-(PIT) 2019-2020 map 18327 eng.jpg Used on 3 pages
709 × 526; 74 KB
 Spain Beneficiaries-of-the-Minimum-Subsistence-Income 2020-2021 statisticalgraph 18561 eng.jpg Used on 3 pages
709 × 1,043; 101 KB
 Spain Tweets-including-solidarity-hashtags-during-the-pandemic.-Lockdown-–-week-2 2020 map 18471 eng.jpg Used on 3 pages
709 × 526; 75 KB
 Spain Downscaling-process.-Seventh-week-(II)-End-of-the-state-of-alarm 2020 map 17762 eng.jpg Used on 3 pages
709 × 525; 77 KB
 Spain Evolution-in-the-amount-of-rail-passengers 2019-2020 statisticalgraph 17778 eng.jpg Used on 3 pages
1,083 × 778; 97 KB
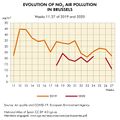 Brussels Evolution-of-NO2-air-pollution-in-Brussels 2019-2020 statisticalgraph 18607 eng.jpg Used on 3 pages
709 × 709; 116 KB
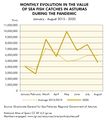 Spain Monthly-evolution-in-the-value-of-sea-fish-catches-in-Asturias-during-the-pandemic 2015-2020 statisticalgraph 18332 eng.jpg Used on 3 pages
850 × 932; 130 KB
 Spain Fall-in-inter--provincial-mobility.-Downscaling-scheme-–-week-1 2020 map 18253 eng.jpg Used on 3 pages
709 × 526; 77 KB
 North-Atlantic Surface-pressure-chart-before-the-pandemic 2020 map 18385 eng.jpg Used on 3 pages
709 × 525; 129 KB

 Spain Hospital-admisssions-due-to-COVID--19-during-the-first-wave-of-the-pandemic 2020 map 18073 eng.jpg Used on 3 pages
709 × 526; 100 KB
 Spain Admissions-to-ICUs-due-to-COVID--19-during-the-first-wave-of-the-pandemic 2020 map 18077 eng.jpg Used on 3 pages
709 × 526; 95 KB
 Spain Weekly-evolution-in-food-prices-during-the-pandemic 2019-2020 statisticalgraph 18347 eng.jpg Used on 3 pages
1,299 × 933; 199 KB
 Spain Deaths-from-COVID--19-over-80-years-of-age-during-the-downward-phase-of-the-pandemic 2020 map 18066 eng.jpg Used on 3 pages
709 × 526; 94 KB
 Spain Employment-contracts-during-the-pandemic 2019-2020 map 18159 eng.jpg Used on 3 pages
709 × 526; 82 KB
 Spain Evolution-in-greenhouse-gas-emissions-and-estimation-of-emissions-without-COVID--19 2018-2020 statisticalgraph 18613 eng.jpg Used on 3 pages
1,083 × 778; 164 KB


.-Asturias_2019-2020_statisticalgraph_18434_eng.jpg)


_2010-2020_statisticalgraph_18336_eng.jpg)
.-Valencia_2019-2020_statisticalgraph_18438_eng.jpg)


_2019-2020_map_18327_eng.jpg)


-End-of-the-state-of-alarm_2020_map_17762_eng.jpg)


