Talk:Urban transport (COVID-19 monograph)
The COVID-19 pandemic in Spain. First wave: from the first cases to the end of June 2020
Monographs from the National Atlas of Spain. New content
Thematic structure > Social, economic and environmental effects > Mobility > Urban transport
-
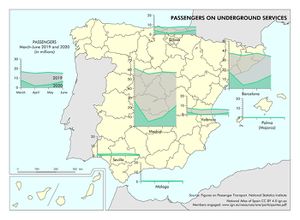
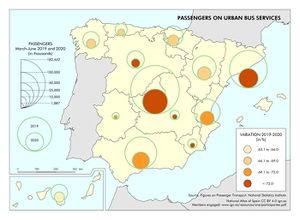
Transport authorities in urban areas were forced to adjust services in spring 2020 to the mobility limitations and restrictions applied to the different means of transport. Bus, underground and metropolitan railway services registered significant falls in the amount of passengers due to vehicle occupancy limits, curfews and shutdowns of non-essential economic activities. In addition, public bicycle schemes were suspended, subsidies for the purchase of bicycles and scooters were awarded, and free parking spaces were provided in public areas that previously required payment due to the rise in the use of private vehicles. Lastly, the existing network of bus and bicycle lanes was extended and more streets were designated as pedestrian-only (Báguena, 2020). 631.8 million passengers used urban bus transport in the first four months of 2019 and fell to only 178.9 million passengers in 2020, what means a drop of 71.7%. Decreases were more acute in larger cities, such as Madrid and Barcelona, which account for 50% of all urban bus trips in the country. Hardly any trips were registered in April 2020 in big cities. However, by June 2020, figures had recovered to 58% of the amount of passengers recorded the previous year. The seven underground systems in Spain transported 439.3 million passengers in the four reference months of 2019, yet only 123.9 million during the same period of 2020. This meant a drop of 71.8%, similar to the one registered for urban bus services. Passengers decreased by 91% in April, and they recovered in June 2020 to 60% of the figure recorded the year before. Although underground avoids congestion and therefore does not compete with other means of transport, it registered a drop in the amount of passengers due to the economic standstill of non-essential activities. The metropolitan areas of Madrid and Barcelona accounted for over 80% of underground trips. Next in terms of passengers, albeit a long way behind, came Bilbao underground service, which registered the smallest drop in the amount of passengers, followed by València.
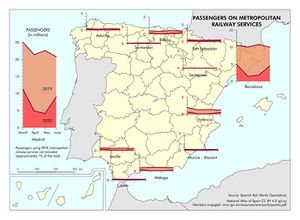
Ticket sales for metropolitan railway services (Cercanías) decreased by 70.5%. The 155.5 million passengers transported in 2019 fell to 45.9 million in the same period of 2020. Madrid and Barcelona, which saw a drop in the amount of passengers by over 70%, accounted for over 80% of all metropolitan railway trips in Spain. Next came València (accounting for 3% of the total amount of passengers), Málaga, Bilbao and Seville (Sevilla). The widespread of home office, the introduction of flexible working hours and the improvements in electronic ticketing and capacity control systems also influenced figures on urban transport (Báguena, 2020). Another factor that contributed to the decrease in urban transport was the temporary closure of universities and schools and the switch to online lessons. However, this varied from one region to another. A study on the use of rail transport (including underground, metropolitan railway and tram services) in the Metropolitan Area of Barcelona relating the variation in tickets used on working days in relation to the average figures in the different neighbourhoods, yields an interesting result. On 16 March 2020, the amount of trips in the lower-income neighbourhoods reached 27.4% of those made in January and February of the same year. However, for the higher-income areas, this datum stood by only 13.2 % (Checa, J., Martín, J., López, J. and Nel·lo, O., 2020). This finding is depicted on the maps included in chapter 11 on the Different spatial behaviours.
Co-authorship of the text in Spanish: Maurici Ruiz Pérez and Joana Maria Seguí Pons. See the list of members engaged
- BÁGUENA RODRIGUEZ, R (2020): «El transporte y la movilidad, actividades esenciales en la pandemia», Movilidad y Transporte en tiempos de COVID 19. Monográfico del Observatorio del Transporte y la Logística en España. Ministerio de Transportes, Movilidad y Agenda Urbana. Available in: https://observatoriotransporte.mitma.es/recursos_otle/01_el_transporte_y_la_movilidad_actividades_esenciales.pdf
You can download the complete publication The COVID-19 pandemic in Spain. First wave: from the first cases to the end of June 2020 in Libros Digitales del ANE site.


