Most linked-to files
Showing below up to 50 results in range #151 to #200.
View (previous 50 | next 50) (20 | 50 | 100 | 250 | 500)
 Malaga Population-density-and-Covid--19-hotspots 2020 map 17733 eng.jpg Used on 3 pages
874 × 618; 152 KB


 Spain Population-living-in-scattered-villages-by-municipality 2020 map 18026 eng.jpg Used on 3 pages
1,388 × 1,016; 264 KB

 Spain Revenue-from-Personal-Income-Tax-(PIT) 2019-2020 map 18327 eng.jpg Used on 3 pages
709 × 526; 74 KB
 Spain Evolution-in-the-amount-of-trips-per-person-during-the-first-wave-of-the-pandemic 2020 statisticalgraph 18416 eng.jpg Used on 3 pages
1,457 × 591; 92 KB
 Spain Tweets-including-solidarity-hashtags-during-the-pandemic.-Lockdown-–-week-2 2020 map 18471 eng.jpg Used on 3 pages
709 × 526; 75 KB
 Spain Evolution-in-the-number-of-deaths-from-COVID--19-during-the-rising-phase-of-the-pandemic 2020 statisticalgraph 17966 eng.jpg Used on 3 pages
1,083 × 778; 124 KB
 Spain Fall-in-inter--provincial-mobility.-Lockdown-–-week-1. 2020 map 18248 eng.jpg Used on 3 pages
709 × 526; 76 KB
 North-Atlantic Upper-air-chart-during-the-pandemic 2020 map 18382 eng.jpg Used on 3 pages
709 × 525; 112 KB
 Spain Investment-in-Regional-Minimum-Income-policies 2020 map 18565 eng.jpg Used on 3 pages
709 × 526; 73 KB

 Spain Companies-registered-in-the-Social-Security-System-by-economic-sector 2019-2020 map 17972 eng.jpg Used on 3 pages
933 × 685; 119 KB
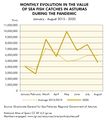 Spain Monthly-evolution-in-the-value-of-sea-fish-catches-in-Asturias-during-the-pandemic 2015-2020 statisticalgraph 18332 eng.jpg Used on 3 pages
850 × 932; 130 KB

 Spain Evolution-in-natural-gas-consumption 2019-2020 map 18581 eng.jpg Used on 3 pages
933 × 685; 100 KB
 Spain Evolution-in-the-average-daily-traffic-flow-(ADTF).-Cantabria 2019-2020 statisticalgraph 18435 eng.jpg Used on 3 pages
1,299 × 1,252; 293 KB
 Europe Main-airports-in-the-European-Union 2019 map 17850 eng.jpg Used on 3 pages
933 × 1,016; 205 KB
 Spain Weekly-evolution-in-food-prices-during-the-pandemic 2019-2020 statisticalgraph 18347 eng.jpg Used on 3 pages
1,299 × 933; 199 KB
 Spain Evolution-in-the-use-of-hospital-beds-by-COVID--19-patients-during-the-first-wave-of-the-pandemic 2020 statisticalgraph 18354 eng.jpg Used on 3 pages
1,083 × 778; 124 KB
 Madrid Evolution-of-NO2-air-pollution-in-Madrid 2019-2020 statisticalgraph 18597 eng.jpg Used on 3 pages
709 × 709; 118 KB
 Spain Fall-in-intra--provincial-mobility.-Lockdown-–-week-4 2020 map 18242 eng.jpg Used on 3 pages
709 × 526; 66 KB
 Spain GENERAL-DETAILS-OF-THE-BALMIS-OPERATION 2020 illustration 18554 eng.jpg Used on 3 pages
1,723 × 821; 188 KB
 Seville Solidarity-initiatives-during-the-pandemic.-Seville 2020 map 18465 eng.jpg Used on 3 pages
933 × 685; 111 KB
 Spain Main-food-products-dispensed-by-the-Spanish-Federation-of-Food-Banks 2019-2020 statisticalgraph 18550 eng.jpg Used on 3 pages
709 × 709; 87 KB
 Spain Benefits-from-the-National-Minimum-Subsistence-Income-by-household-in-poverty 2020 map 18208 eng.jpg Used on 3 pages
709 × 526; 68 KB
 Spain Coverage-of-unemployment-benefits 2019-2020 map 17871 eng.jpg Used on 3 pages
933 × 685; 122 KB
 Spain Passengers-on-domestic-flights-from-main-airports 2019-2020 map 18202 eng.jpg Used on 3 pages
933 × 685; 137 KB
 Spain Registered-unemployment-by-economic-sector-during-the-first-wave-of-the-pandemic 2019-2020 map 17844 eng.jpg Used on 3 pages
933 × 685; 143 KB
 Barcelona Noise-levels-in-Barcelona-during-the-first-wave-of-the-pandemic 2019-2020 statisticalgraph 18615 eng.jpg Used on 3 pages
1,083 × 778; 126 KB
 Spain Evolution-in-the-industrial-production-index 2018-2020 statisticalgraph 17801 eng.jpg Used on 3 pages
1,299 × 933; 219 KB
 Galicia Spotlights-propagation-COVID--19-in-Santiago-de-Compostela 2020 map 17887 eng.jpg Used on 3 pages
654 × 730; 111 KB
 Vienna Evolution-of-NO2-air-pollution-in-Vienna 2019-2020 statisticalgraph 18602 eng.jpg Used on 3 pages
709 × 709; 116 KB
 Spain Evolution-of-total-public-spending-by-the-regional-administrations 2012-2019 map 18538 eng.jpg Used on 3 pages
933 × 685; 117 KB

 Spain Hospitals-according-to-the-purpose-of-care 2019 map 18360 eng.jpg Used on 3 pages
933 × 685; 124 KB
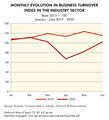 Spain Monthly-evolution-in-Business-Turnover-Index-in-the-industry-sector 2019-2020 statisticalgraph 18488 eng.jpg Used on 3 pages
850 × 932; 107 KB

 Spain Population-living-in-scattered-villages 2020 map 18024 eng.jpg Used on 3 pages
709 × 526; 93 KB
 Spain Estimated-youth-unemployment-during-the-first-wave-of-the-pandemic 2020 map 17848 eng.jpg Used on 3 pages
709 × 526; 88 KB


_2019-2020_map_18327_eng.jpg)


.-Cantabria_2019-2020_statisticalgraph_18435_eng.jpg)


