Most linked-to files
Showing below up to 50 results in range #201 to #250.
View (previous 50 | next 50) (20 | 50 | 100 | 250 | 500)
 Madrid Solidarity-initiatives-during-the-pandemic.-Madrid 2020 map 18464 eng.jpg Used on 3 pages
1,388 × 1,016; 255 KB
 Spain Fall-in-mobility-with-Catalonia-during-lockdown 2020 map 18268 eng.jpg Used on 3 pages
933 × 685; 123 KB
 Saragossa Households-in-which-5-or-more-people-live-in-less-than-90-m2.-City-of-Zaragoza 2019 map 18150 eng.jpg Used on 3 pages
1,329 × 957; 249 KB
 Spain Beneficiaries-of-the-Active-Insertion-Income-according-to-group 2020 statisticalgraph 18569 eng.jpg Used on 3 pages
709 × 679; 96 KB
 Spain Monthly-evolution-in-the-amount-of-furloughed-workers-in-tourism-during-the-pandemic 2020 statisticalgraph 18318 eng.jpg Used on 3 pages
1,759 × 850; 196 KB


 Spain Evolution-in-real--estate-mortgages-signed-during-the-pandemic 2019-2020 statisticalgraph 18535 eng.jpg Used on 3 pages
850 × 850; 120 KB
 Spain Evolution-in-the-average-daily-traffic-flow-(ADTF).-Murcia 2019-2020 statisticalgraph 18433 eng.jpg Used on 3 pages
1,299 × 1,252; 283 KB
 Europe Public-deficit-in-the-member-states-of-the-European-Union 2011-2020 map 18392 eng.jpg Used on 3 pages
1,388 × 1,016; 189 KB
 Spain Evolution-of-covid--19-cases-during-the-downscaling-process 2020 statisticalgraph 18134 eng.jpg Used on 3 pages
708 × 807; 161 KB


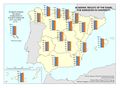 Spain Academic-results-of-the-exams-for-admissions-in-university 2019-2020 map 18222 eng.jpg Used on 3 pages
933 × 685; 108 KB
 Spain COVID--19-cases-during-the-downward-phase-of-the-pandemic 2020 map 17736 eng.jpg Used on 3 pages
709 × 526; 102 KB
 Spain Public-expenditure-of-the-regional-administrations-per-capita 2020 map 18390 eng.jpg Used on 3 pages
709 × 526; 64 KB
 Spain Deaths-from-COVID--19-during-the-downward-phase-pf-the-pandemic 2020 map 18038 eng.jpg Used on 3 pages
709 × 526; 91 KB
 Spain Tax-revenue-for-the-public-treasury 2019-2020 map 18325 eng.jpg Used on 3 pages
933 × 685; 99 KB
 Spain Electricity-production-and-year--on--year-variation 2019-2020 map 18577 eng.jpg Used on 3 pages
933 × 685; 141 KB
 Spain Evolution-in-the-amount-of-households-where-all-active-members-are-unemployed 2005-2020 statisticalgraph 18364 eng.jpg Used on 3 pages
1,083 × 778; 182 KB
 Berlin Evolution-of-NO2-air-pollution-in-Berlin 2019-2020 statisticalgraph 18596 eng.jpg Used on 3 pages
709 × 709; 114 KB
 Spain Evolution-in-the-number-of-ICU-beds-during-the-first-wave-of-the-pandemic 2020 map 18511 eng.jpg Used on 3 pages
709 × 526; 85 KB
 Spain Fall-in-intra--provincial-mobility.-Downscaling-process-–-week-1 2020 map 18244 eng.jpg Used on 3 pages
709 × 526; 76 KB

 Spain People-assisted-by-the-Spanish-Red-Cross-during-the-first-wave-of-the-pandemic 2020 statisticalgraph 18476 eng.jpg Used on 3 pages
709 × 709; 90 KB
 Spain Monthly-evolution-in-registered-unemployed-in-sales--services-and-trade-during-the-pandemic 2019-2020 map 18529 eng.jpg Used on 3 pages
709 × 526; 77 KB
 Spain Reported-prevalence-of-COPD-in-the-population-over-15-years-of-age 2017 map 17860 eng.jpg Used on 3 pages
709 × 526; 71 KB

 Spain Evolution-in-acceptances-of-inheritance-deeds-during-the-pandemic 2019-2020 statisticalgraph 18536 eng.jpg Used on 3 pages
850 × 850; 120 KB
 World Evolution-in-the-number-of-deaths-from-COVID--19-worldwide 2020 statisticalgraph 17715 eng.jpg Used on 3 pages
1,083 × 778; 143 KB
 Spain Evolution-in-the-average-daily-traffic-flow-(ADTF)-Toledo 2019-2020 statisticalgraph 18437 eng.jpg Used on 3 pages
1,299 × 1,252; 291 KB
 Europe Deaths-from-COVID--19-in-the-European-Union 2020 map 17793 eng.jpg Used on 3 pages
1,388 × 1,016; 176 KB
 Spain Evolution-in-the-number-of-interventions-under-Operation-Balmis 2020 statisticalgraph 18516 eng.jpg Used on 3 pages
1,457 × 689; 116 KB
 Logrono Evolution-in-the-average-daily-temperature-in-February-in-Logrono-(airport) 1981-2020 statisticalgraph 18410 eng.jpg Used on 3 pages
709 × 709; 120 KB
 Madrid Synthetic-vulnerability-index.-City-of-Madrid 2017 map 18012 eng.jpg Used on 3 pages
1,388 × 1,016; 179 KB
 Spain Female-beneficiaries-of-Active-Insertion-Income-by-group 2020 statisticalgraph 18571 eng.jpg Used on 3 pages
709 × 679; 94 KB
 Saragossa Variation-in-home-office-during-lockdown.-City-of-Zaragoza 2020 map 18153 eng.jpg Used on 3 pages
650 × 467; 90 KB
 Spain Beneficiaries-of-the-Active-Insertion-Income-by-age 2020 map 18567 eng.jpg Used on 3 pages
933 × 685; 131 KB


 Spain Evolution-in-registered-unemployment 2015-2020 statisticalgraph 17839 eng.jpg Used on 3 pages
1,456 × 1,043; 144 KB

 Spain Evolution-in-the-average-daily-traffic-flow-(ADTF).-Saragossa 2019-2020 statisticalgraph 18440 eng.jpg Used on 3 pages
1,299 × 1,252; 289 KB
 Spain Evolution-of-e--commerce-turnover-during-the-pandemic 2019-2020 statisticalgraph 18534 eng.jpg Used on 3 pages
1,299 × 933; 138 KB
 Milan Evolution-of-NO2-air-pollution-in-Milan 2019-2020 statisticalgraph 18598 eng.jpg Used on 3 pages
709 × 709; 120 KB
 Spain Hospital-admissions-due-to-COVID--19-during-the-downward-phase-of-the-pandemic 2020 map 18036 eng.jpg Used on 3 pages
709 × 526; 99 KB


.-Murcia_2019-2020_statisticalgraph_18433_eng.jpg)


-Toledo_2019-2020_statisticalgraph_18437_eng.jpg)


_1981-2020_statisticalgraph_18410_eng.jpg)


.-Saragossa_2019-2020_statisticalgraph_18440_eng.jpg)


