Gallery of new files
This special page shows the last uploaded files.
 Spain Evolution-in-the-amount-of-workers-affiliated-to-the-Social-Security-system 2019-2020 statisticalgraph 18359 eng.jpg Usr20
09:04, 27 May 2022
1,554 × 738; 143 KB
 Spain Evolution-in-the-amount-of-households-with-no-income 2005-2020 statisticalgraph 17864 eng.jpg Usr20
09:04, 27 May 2022
1,299 × 933; 174 KB
 Spain Evolution-in-the-amount-of-households-where-all-active-members-are-unemployed 2005-2020 statisticalgraph 18364 eng.jpg Usr20
09:04, 27 May 2022
1,083 × 778; 182 KB
 Spain Evolution-in-registered-unemployment 2015-2020 statisticalgraph 17839 eng.jpg Usr20
09:04, 27 May 2022
1,456 × 1,043; 144 KB

 Spain Estimated-youth-unemployment-during-the-first-wave-of-the-pandemic 2020 map 17848 eng.jpg Usr20
09:04, 27 May 2022
709 × 526; 88 KB
 Spain Estimated-unemployment-by-sex 2019 map 17845 eng.jpg Usr20
09:04, 27 May 2022
709 × 526; 84 KB
 Spain Estimated-unemployment-by-sex-during-the-fisrt-wave-of-the-pandemic 2020 map 17846 eng.jpg Usr20
09:04, 27 May 2022
709 × 526; 87 KB
 Spain Employment-contracts-during-the-pandemic 2019-2020 map 18159 eng.jpg Usr20
09:04, 27 May 2022
709 × 526; 82 KB
 Spain Coverage-of-unemployment-benefits 2019-2020 map 17871 eng.jpg Usr20
09:04, 27 May 2022
933 × 685; 122 KB
 Spain Companies-using-furlough-schemes 2020 map 17874 eng.jpg Usr20
09:04, 27 May 2022
933 × 685; 138 KB
 Spain Companies-using-furlough-schemes-according-to-economic-sector 2020 statisticalgraph 17876 eng.jpg Usr20
09:04, 27 May 2022
1,654 × 1,252; 191 KB
 Spain Beneficiaries-of-unemployment-benefits 2019-2020 map 17873 eng.jpg Usr20
09:04, 27 May 2022
933 × 685; 119 KB
 Spain Benefits-from-the-National-Minimum-Subsistence-Income-by-household 2020 map 18207 eng.jpg Usr20
09:04, 27 May 2022
709 × 526; 74 KB
 Spain Benefits-from-the-National-Minimum-Subsistence-Income-by-household-in-poverty 2020 map 18208 eng.jpg Usr20
09:04, 27 May 2022
709 × 526; 68 KB
 Spain Weekly-evolution-of-the-change-in-the-cumulative-number-of-deaths-during-the-first-wave-of-the-pandemic 2019-2020 statisticalgraph 18174 eng.jpg Usr18
08:35, 27 May 2022
1,456 × 497; 128 KB
 Spain Evolution-in-the-number-of-deaths-from-COVID--19-during-the-first-wave-of-the-pandemic 2020 statisticalgraph 18081 eng.jpg Usr18
08:35, 27 May 2022
1,083 × 778; 213 KB
 Spain Change-in-the-cumulative-number-of-deaths-during-the-first-wave-of-the-pandemic-by-age-and-sex 2019-2020 statisticalgraph 18198 eng.jpg Usr18
08:35, 27 May 2022
1,083 × 778; 120 KB
 World Variation-of-CO2-emissions-due-COVID--19-confinement-in-the-world 2019-2020 statisticalgraph 18085 eng.jpg Usr20
15:34, 26 May 2022
1,729 × 762; 134 KB
 World Global-distribution-of-workers-in-poverty 2010-2020 statisticalgraph 18083 eng.jpg Usr20
15:33, 26 May 2022
1,107 × 738; 102 KB
 World Evolution-of-the-Labour-Market-worldwide 2000-2020 statisticalgraph 18082 eng.jpg Usr20
15:33, 26 May 2022
1,107 × 738; 137 KB
 World Evolution-of-COVID--19-cases-worldwide 2020 statisticalgraph 17714 eng.jpg Usr20
15:33, 26 May 2022
1,083 × 778; 181 KB
 World Evolution-of-COVID--19-cases-in-most-affected-countries 2020 statisticalgraph 17719 eng.jpg Usr20
15:33, 26 May 2022
1,083 × 778; 163 KB
 World Evolution-of-COVID--19-cases-by-major-regions-of-the-world 2020 statisticalgraph 17716 eng.jpg Usr20
15:33, 26 May 2022
1,083 × 778; 150 KB
 World Evolution-in-the-number-of-deaths-from-COVID--19-worldwide 2020 statisticalgraph 17715 eng.jpg Usr20
15:33, 26 May 2022
1,083 × 778; 143 KB
 China Origins-and-spread-of-Covid--19-in-China 2020 map 17842 eng.jpg Usr20
15:33, 26 May 2022
933 × 685; 123 KB
 Europe Evolution-of-COVID--19-cases-in-the-European-Union 2020 statisticalgraph 17795 eng.jpg Usr20
15:33, 26 May 2022
1,299 × 933; 190 KB
 Europe Evolution-in-the-number-of-deaths-from-Covid--19-in-the-European-Union 2020 statisticalgraph 17796 eng.jpg Usr20
15:33, 26 May 2022
1,299 × 933; 176 KB
 Spain Quarterly-evolution-in-the-amount-of-employed-in-tourism-during-the-pandemic 2019 statisticalgraph 18259 eng.jpg Usr18
12:14, 26 May 2022
850 × 850; 89 KB
 Spain Monthly-evolution-in-the-amount-of-furloughed-workers-in-tourism-during-the-pandemic 2020 statisticalgraph 18318 eng.jpg Usr18
12:14, 26 May 2022
1,759 × 850; 196 KB
 Spain Monthly-evolution-in-the-amount-of-furloughed-workers-in-the-industry-sector-during-the-pandemic 2020 statisticalgraph 18485 eng.jpg Usr18
12:14, 26 May 2022
850 × 932; 170 KB
 Spain Monthly-evolution-in-the-amount-of-furloughed-workers-in-the-food-processing-industry-during-the-pandemic 2020 statisticalgraph 18321 eng.jpg Usr18
12:14, 26 May 2022
850 × 850; 147 KB
 Spain Monthly-evolution-in-the-amount-of-furloughed-workers-in-the-energy-sector-during-the-pandemic 2020 statisticalgraph 18484 eng.jpg Usr18
12:14, 26 May 2022
850 × 932; 150 KB
 Spain Monthly-evolution-in-the-amount-of-furloughed-workers-in-the-construction-sector-during-the-pandemic 2020 statisticalgraph 18486 eng.jpg Usr18
12:14, 26 May 2022
850 × 932; 162 KB
 Spain Monthly-evolution-in-the-amount-of-furloughed-workers-in-sales--services-and-trade-during-the-pandemic 2020 statisticalgraph 18532 eng.jpg Usr18
12:14, 26 May 2022
1,298 × 850; 169 KB
 Spain Evolution-in-the-services-sector-activity-indicators 2018-2020 statisticalgraph 17802 eng.jpg Usr18
12:14, 26 May 2022
1,299 × 933; 214 KB
 Spain Evolution-in-the-industrial-production-index 2018-2020 statisticalgraph 17801 eng.jpg Usr18
12:13, 26 May 2022
1,299 × 933; 219 KB
 Spain Evolution-in-the-amount-of-employed-by-economic-sector 2018-2020 statisticalgraph 17785 eng.jpg Usr18
12:13, 26 May 2022
1,299 × 933; 167 KB
 Spain Evolution-in-the-amount-of-companies-registered-in-the-Social-Security-system-by-economic-sector 2019-2020 statisticalgraph 17964 eng.jpg Usr18
12:13, 26 May 2022
1,299 × 933; 151 KB
 Spain Evolution-in-companies-established-and-dissolved 2018-2020 statisticalgraph 17788 eng.jpg Usr18
12:13, 26 May 2022
1,299 × 933; 195 KB
 Spain Evolution-in-Gross-Value-Added 2018-2020 statisticalgraph 17959 eng.jpg Usr18
12:13, 26 May 2022
1,299 × 933; 197 KB
 Spain Companies-using-home-office--in-the-industry-and-construction-sectors 2020 statisticalgraph 18501 eng.jpg Usr18
12:13, 26 May 2022
850 × 932; 101 KB
 Spain Weekly-evolution-in-food-prices-during-the-pandemic 2019-2020 statisticalgraph 18369 eng.jpg Usr18
09:47, 26 May 2022
1,299 × 933; 193 KB
 Spain Weekly-evolution-in-food-prices-during-the-pandemic 2019-2020 statisticalgraph 18347 eng.jpg Usr18
09:47, 26 May 2022
1,299 × 933; 199 KB
 Spain Monthly-evolution-of-milk-production-during-the-pandemic 2019-2020 statisticalgraph 18345 eng.jpg Usr18
09:47, 26 May 2022
1,299 × 826; 137 KB
 Spain Monthly-evolution-of-meat-production-during-the-pandemic 2019-2020 statisticalgraph 18346 eng.jpg Usr18
09:47, 26 May 2022
1,299 × 826; 153 KB
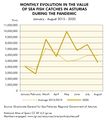 Spain Monthly-evolution-in-the-value-of-sea-fish-catches-in-Asturias-during-the-pandemic 2015-2020 statisticalgraph 18332 eng.jpg Usr18
09:47, 26 May 2022
850 × 932; 130 KB
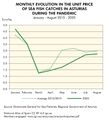 Spain Monthly-evolution-in-the-unit-price-of-sea-fish-catches-in-Asturias-during-the-pandemic 2015-2020 statisticalgraph 18333 eng.jpg Usr18
09:47, 26 May 2022
850 × 932; 122 KB


