Gallery of new files
This special page shows the last uploaded files.
 Spain Population-over-65-years-of-age-in-the-Region-of-Madrid 2020 map 18138 eng.jpg Usr17
09:59, 31 May 2022
933 × 685; 148 KB
 Saragossa Households-in-which-5-or-more-people-live-in-less-than-90-m2.-City-of-Zaragoza 2019 map 18150 eng.jpg Usr17
09:59, 31 May 2022
1,329 × 957; 249 KB
 Saragossa Emotional-conditions-during-lockdown.-City-of-Zaragoza 2020 map 18154 eng.jpg Usr17
09:59, 31 May 2022
650 × 467; 90 KB
 Madrid Synthetic-vulnerability-index.-City-of-Madrid 2017 map 18012 eng.jpg Usr17
09:59, 31 May 2022
1,388 × 1,016; 179 KB
 Madrid Population-over-65-years-of-age-in-the-city-of-Madrid 2020 map 18139 eng.jpg Usr17
09:59, 31 May 2022
709 × 756; 96 KB
 Barcelona Synthetic-vulnerability-index.-City-of-Barcelona 2017 map 18011 eng.jpg Usr17
09:59, 31 May 2022
1,388 × 1,016; 169 KB
 Saragossa Variation-in-home-office-during-lockdown.-City-of-Zaragoza 2020 map 18153 eng.jpg Usr17
09:55, 31 May 2022
650 × 467; 90 KB
 Saragossa Employment-during-lockdown.-City-of-Zaragoza 2020 map 18152 eng.jpg Usr17
09:55, 31 May 2022
650 × 467; 90 KB
 Madrid Unemployed-in-the-city-of-Madrid 2020 map 17774 eng.jpg Usr17
09:55, 31 May 2022
709 × 756; 81 KB
 Spain Trends-in-wasterwater-pollution-by-SARS--COV--2 2020 map 18589 eng.jpg Usr18
09:23, 31 May 2022
1,388 × 1,016; 188 KB
 Seville Variation-in-the-vegetation-index-in-the-city-of-Seville-during-the-first-wave-of-the-pandemic 2017-2020 map 18583 eng.jpg Usr18
09:23, 31 May 2022
1,329 × 990; 459 KB
 Madrid Variation-in-noise-levels-in-Madrid-during-lockdown 2019-2020 map 18614 eng.jpg Usr18
09:23, 31 May 2022
709 × 756; 107 KB
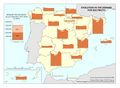 Spain Evolution-in-the-demand-for-electricity 2019-2020 map 18621 eng.jpg Usr18
08:28, 31 May 2022
933 × 685; 97 KB
 Spain Evolution-in-petrol-and-diesel-consumption 2019-2020 map 18580 eng.jpg Usr18
08:28, 31 May 2022
933 × 685; 96 KB
 Spain Evolution-in-natural-gas-consumption 2019-2020 map 18581 eng.jpg Usr18
08:28, 31 May 2022
933 × 685; 100 KB
 Spain Electricity-production-and-year--on--year-variation 2019-2020 map 18577 eng.jpg Usr18
08:28, 31 May 2022
933 × 685; 141 KB

 Spain Average-Solar-Insolation-in-March 2020 map 18394 eng.jpg Usr18
07:14, 31 May 2022
709 × 525; 79 KB
 Spain Average-Solar-Insolation-in-March 1981-2010 map 18404 eng.jpg Usr18
07:14, 31 May 2022
709 × 525; 78 KB
 Spain Average-February-temperature 1981-2010 map 18405 eng.jpg Usr18
07:14, 31 May 2022
709 × 525; 97 KB
 North-Atlantic Upper-air-chart-during-the-pandemic 2020 map 18382 eng.jpg Usr18
07:14, 31 May 2022
709 × 525; 112 KB
 North-Atlantic Upper-air-chart-before-the-pandemic 2020 map 18383 eng.jpg Usr18
07:14, 31 May 2022
709 × 525; 115 KB
 North-Atlantic Surface-pressure-chart-during-the-pandemic 2020 map 18384 eng.jpg Usr18
07:14, 31 May 2022
709 × 525; 129 KB
 North-Atlantic Surface-pressure-chart-before-the-pandemic 2020 map 18385 eng.jpg Usr18
07:14, 31 May 2022
709 × 525; 129 KB
 Seville Image-of-the-city-of-Seville-from-the-National-Aerial-Orthophotography-Plan-(PNOA) 2019 image 18584 eng.jpg Usr18
06:35, 31 May 2022
1,828 × 1,446; 914 KB
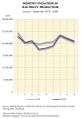 Spain Monthly-evolution-in-electricity-production 2019-2020 statisticalgraph 18576 eng.jpg Usr18
06:34, 31 May 2022
709 × 1,043; 103 KB
 Spain Evolution-in-the-demand-for-electricity 2019-2020 statisticalgraph 18622 eng.jpg Usr18
06:34, 31 May 2022
689 × 1,043; 107 KB
 Spain Evolution-in-petroleum-product-consumption 2019-2020 statisticalgraph 18579 eng.jpg Usr18
06:34, 31 May 2022
1,456 × 1,043; 163 KB
 Valladolid Monthly-evolution-in-ultraviolet-radiation-in-Valladolid 2019-2020 statisticalgraph 18421 eng.jpg Usr18
06:18, 31 May 2022
1,082 × 728; 176 KB
 Valencia Monthly-evolution-in-ultraviolet-radiation-in-Valencia-(airport) 2019-2020 statisticalgraph 18422 eng.jpg Usr18
06:18, 31 May 2022
1,082 × 728; 176 KB
 Seville Evolution-in-water-consumption-by-the-industry-in-the-city-of-Seville 2019-2020 statisticalgraph 18619 eng.jpg Usr18
06:18, 31 May 2022
1,083 × 778; 112 KB
 Seville Evolution-in--water-consumption-by-households-in-the-city-of-Seville 2019-2020 statisticalgraph 18618 eng.jpg Usr18
06:18, 31 May 2022
1,083 × 778; 114 KB
 Seville Daily-variation-in-the-water-supplied-in-Seville-during-the-first-wave-of-the-pandemic 2019-2020 statisticalgraph 18620 eng.jpg Usr18
06:18, 31 May 2022
2,215 × 778; 239 KB
 Palma Evolution-in-the-average-daily-temperature-in-February-in-Palma-(port) 1981-2020 statisticalgraph 18409 eng.jpg Usr18
06:18, 31 May 2022
709 × 709; 124 KB
 Madrid Evolution-in-the-average-daily-temperature-in-February-in-Madrid-(Retiro) 1981-2020 statisticalgraph 18407 eng.jpg Usr18
06:18, 31 May 2022
709 × 709; 126 KB
 Logrono Evolution-in-the-average-daily-temperature-in-February-in-Logrono-(airport) 1981-2020 statisticalgraph 18410 eng.jpg Usr18
06:18, 31 May 2022
709 × 709; 120 KB
 Gran-Canaria Evolution-in-the-average-daily-temperature-in-February-in-Gran-Canaria-(airport) 1981-2020 statisticalgraph 18411 eng.jpg Usr18
06:18, 31 May 2022
709 × 709; 126 KB
 Bilbao Evolution-in-the-average-daily-temperature-in-February-in-Bilbao-(airport) 1981-2020 statisticalgraph 18408 eng.jpg Usr18
06:18, 31 May 2022
709 × 709; 122 KB
 Barcelona Evolution-in-the-average-daily-temperature-in-February-in-Barcelona-(airport) 1981-2020 statisticalgraph 18406 eng.jpg Usr18
06:18, 31 May 2022
709 × 709; 120 KB
 Warsaw Evolution-of-NO2-air-pollution-in-Warsaw 2019-2020 statisticalgraph 18601 eng.jpg Usr18
05:53, 31 May 2022
709 × 709; 119 KB
 Vienna Evolution-of-NO2-air-pollution-in-Vienna 2019-2020 statisticalgraph 18602 eng.jpg Usr18
05:53, 31 May 2022
709 × 709; 116 KB
 Prague Evolution-of-NO2-air-pollution-in-Prague 2019-2020 statisticalgraph 18600 eng.jpg Usr18
05:53, 31 May 2022
709 × 709; 116 KB
 Paris Evolution-of-NO2-air-pollution-in-Paris 2019-2020 statisticalgraph 18599 eng.jpg Usr18
05:53, 31 May 2022
709 × 709; 122 KB
 Milan Evolution-of-NO2-air-pollution-in-Milan 2019-2020 statisticalgraph 18598 eng.jpg Usr18
05:53, 31 May 2022
709 × 709; 120 KB
 London Evolution-of-NO2-air-pollution-in-London 2019-2020 statisticalgraph 18608 eng.jpg Usr18
05:53, 31 May 2022
709 × 709; 117 KB
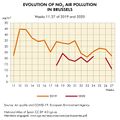 Brussels Evolution-of-NO2-air-pollution-in-Brussels 2019-2020 statisticalgraph 18607 eng.jpg Usr18
05:53, 31 May 2022
709 × 709; 116 KB
 Berlin Evolution-of-NO2-air-pollution-in-Berlin 2019-2020 statisticalgraph 18596 eng.jpg Usr18
05:53, 31 May 2022
709 × 709; 114 KB
 Athens Evolution-of-NO2-air-pollution-in-Athens 2019-2020 statisticalgraph 18606 eng.jpg Usr18
05:53, 31 May 2022
709 × 709; 119 KB
 Spain Noise-pollution-in-Madrid-during-lockdown 2019-2020 statisticalgraph 18617 eng.jpg Usr18
13:19, 30 May 2022
1,299 × 933; 206 KB
 Spain Monthly-variation-in-greenhouse-gas-emissions 2019-2020 statisticalgraph 18611 eng.jpg Usr18
13:19, 30 May 2022
709 × 709; 85 KB


_2019_image_18584_eng.jpg)


_2019-2020_statisticalgraph_18422_eng.jpg)


_1981-2020_statisticalgraph_18409_eng.jpg)
_1981-2020_statisticalgraph_18407_eng.jpg)
_1981-2020_statisticalgraph_18410_eng.jpg)
_1981-2020_statisticalgraph_18411_eng.jpg)
_1981-2020_statisticalgraph_18408_eng.jpg)
_1981-2020_statisticalgraph_18406_eng.jpg)


