Gallery of new files
This special page shows the last uploaded files.
 Spain Population-leaving-their-mobility-area-during-the-first-wave-of-the-pandemic 2020 statisticalgraph 18256 eng.jpg Usr15
12:12, 1 June 2022
1,457 × 778; 145 KB
 Spain Evolution-of-air-freight-traffic 2019-2020 statisticalgraph 18238 eng.jpg Usr15
12:12, 1 June 2022
689 × 1,033; 156 KB
 Spain Evolution-in-the-number-of-trips-during-the-first-wave-of-the-pandemic 2020 statisticalgraph 18367 eng.jpg Usr15
12:12, 1 June 2022
1,457 × 778; 207 KB
 Spain Evolution-in-the-number-of-travellers--km-during-the-first-wave-of-the-pandemic 2020 statisticalgraph 18368 eng.jpg Usr15
12:12, 1 June 2022
1,457 × 778; 200 KB
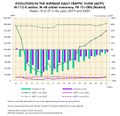
 Spain Evolution-in-the-average-daily-traffic-flow-(ADTF).-Valladolid 2019-2020 statisticalgraph 18439 eng.jpg Usr15
12:12, 1 June 2022
1,299 × 1,252; 296 KB
 Spain Evolution-in-the-average-daily-traffic-flow-(ADTF)-Toledo 2019-2020 statisticalgraph 18437 eng.jpg Usr15
12:12, 1 June 2022
1,299 × 1,252; 291 KB
 Spain Evolution-in-the-average-daily-traffic-flow-(ADTF)-Madrid 2019-2020 statisticalgraph 18431 eng.jpg Usr15
12:12, 1 June 2022
1,299 × 1,252; 296 KB
 Spain Evolution-in-the-average-daily-traffic-flow-(ADTF).-Valencia 2019-2020 statisticalgraph 18438 eng.jpg Usr15
12:12, 1 June 2022
1,299 × 1,252; 287 KB
 Spain Evolution-in-the-average-daily-traffic-flow-(ADTF).-Seville 2019-2020 statisticalgraph 18436 eng.jpg Usr15
12:12, 1 June 2022
1,299 × 1,252; 276 KB
 Spain Evolution-in-the-average-daily-traffic-flow-(ADTF).-Saragossa 2019-2020 statisticalgraph 18440 eng.jpg Usr15
12:12, 1 June 2022
1,299 × 1,252; 289 KB
 Spain Evolution-in-the-average-daily-traffic-flow-(ADTF).-Murcia 2019-2020 statisticalgraph 18433 eng.jpg Usr15
12:12, 1 June 2022
1,299 × 1,252; 283 KB
 Spain Evolution-in-the-average-daily-traffic-flow-(ADTF).-Malaga 2019-2020 statisticalgraph 18432 eng.jpg Usr15
12:12, 1 June 2022
1,299 × 1,252; 293 KB
 Spain Evolution-in-the-average-daily-traffic-flow-(ADTF).-La-Rioja 2019-2020 statisticalgraph 18430 eng.jpg Usr15
12:12, 1 June 2022
1,299 × 1,252; 279 KB
 Spain Evolution-in-the-average-daily-traffic-flow-(ADTF).-Corunna 2019-2020 statisticalgraph 18429 eng.jpg Usr15
12:12, 1 June 2022
1,299 × 1,252; 276 KB
 Spain Evolution-in-the-average-daily-traffic-flow-(ADTF).-Cantabria 2019-2020 statisticalgraph 18435 eng.jpg Usr15
12:12, 1 June 2022
1,299 × 1,252; 293 KB
 Spain Evolution-in-the-average-daily-traffic-flow-(ADTF).-Burgos 2019-2020 statisticalgraph 18428 eng.jpg Usr15
12:12, 1 June 2022
1,299 × 1,252; 291 KB
 Spain Evolution-in-the-average-daily-traffic-flow-(ADTF).-Barcelona 2019-2020 statisticalgraph 18426 eng.jpg Usr15
12:12, 1 June 2022
1,299 × 1,252; 272 KB
 Spain Evolution-in-the-average-daily-traffic-flow-(ADTF).-Badajoz 2019-2020 statisticalgraph 18427 eng.jpg Usr15
12:12, 1 June 2022
1,299 × 1,252; 269 KB
 Spain Evolution-in-the-average-daily-traffic-flow-(ADTF).-Asturias 2019-2020 statisticalgraph 18434 eng.jpg Usr15
12:12, 1 June 2022
1,299 × 1,252; 285 KB
 Spain Evolution-in-the-average-daily-traffic-flow-(ADTF).-Alicante 2019-2020 statisticalgraph 18420 eng.jpg Usr15
12:11, 1 June 2022
1,299 × 1,252; 275 KB
 Spain Evolution-in-the-amount-of-trips-per-person-during-the-first-wave-of-the-pandemic 2020 statisticalgraph 18416 eng.jpg Usr15
12:11, 1 June 2022
1,457 × 591; 92 KB
 Spain Evolution-in-the-amount-of-rail-passengers 2019-2020 statisticalgraph 17778 eng.jpg Usr15
12:11, 1 June 2022
1,083 × 778; 97 KB
 Spain Evolution-in-the-amount-of-passengers-at-Spanish-airports 2018-2020 statisticalgraph 18417 eng.jpg Usr15
12:11, 1 June 2022
1,081 × 531; 113 KB
 Spain Evolution-in-the-amount-of-cruise-passengers 2018-2020 statisticalgraph 18418 eng.jpg Usr15
12:11, 1 June 2022
1,081 × 531; 106 KB
 Spain Evolution-in-rail-freight-transport 2019-2020 statisticalgraph 17779 eng.jpg Usr15
12:11, 1 June 2022
1,083 × 778; 139 KB
 Spain Evolution-of-hospital-admissions-due-to-Covid--19-during-the-downscaling-process 2020 statisticalgraph 18135 eng.jpg Usr17
12:00, 1 June 2022
708 × 807; 121 KB
 Spain Evolution-of-hospital-admissions-due-to-Covid--19--during-the-downward-phase-of-the-pandemic 2020 statisticalgraph 18033 eng.jpg Usr17
12:00, 1 June 2022
1,083 × 778; 132 KB
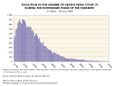
 Spain Evolution-of-COVID--19-cases-during-the-downward-phase-of-the-pandemic 2020 statisticalgraph 17735 eng.jpg Usr17
12:00, 1 June 2022
1,083 × 778; 159 KB
 Spain Evolution-of-covid--19-cases-during-the-downscaling-process 2020 statisticalgraph 18134 eng.jpg Usr17
11:59, 1 June 2022
708 × 807; 161 KB
 Spain Evolution-in-the-number-of-deaths-from-covid--19-during-the-downscaling-process 2020 statisticalgraph 18137 eng.jpg Usr17
11:59, 1 June 2022
708 × 807; 140 KB
 Spain Evolution-in-the-number-of-deaths-from-Covid--19-during-the-downward-phase-of-the-pandemic 2020 statisticalgraph 18032 eng.jpg Usr17
11:59, 1 June 2022
1,083 × 778; 160 KB
 Spain Age--sex-pyramid-of-the-deceased-from-COVID--19-during-the-downward-phase-of-the-pandemic 2020 statisticalgraph 18071 eng.jpg Usr17
11:59, 1 June 2022
1,299 × 933; 150 KB
 Barcelona Mobility-on-public-transport-in-relation-to-personal-income.-Metropolitan-Area-of-Barcelona 2020 statisticalgraph 18018 eng.jpg Usr17
07:31, 1 June 2022
1,083 × 640; 177 KB
 Madrid Evolution-of-covid--19-cases-in-the-Region-of-Madrid 2020 statisticalgraph 17911 eng.jpg Usr17
12:37, 31 May 2022
1,457 × 778; 144 KB
 Barcelona Incidence-of-COVID--19-in-relation-to-social-vulnerability-and-income 2020 statisticalgraph 17945 eng.jpg Usr17
12:37, 31 May 2022
689 × 1,033; 99 KB
 Saragossa Variation-in-spending-on-television-subscriptions-during-lockdown.-City-of-Zaragoza 2020 map 18155 eng.jpg Usr17
10:04, 31 May 2022
650 × 467; 90 KB
 Barcelona Mobility-on-public-rail-transport.-Metropolitan-Area-of-Barcelona 2020 map 17991 eng.jpg Usr17
10:04, 31 May 2022
933 × 946; 162 KB
 Barcelona Mobility-on-public-rail-transport.-City-of-Barcelona 2020 map 17992 eng.jpg Usr17
10:04, 31 May 2022
933 × 685; 121 KB
 Saragossa COVID--19-frequentation-rate.-City-of-Zaragoza 2020 map 18151 eng.jpg Usr17
10:02, 31 May 2022
1,330 × 958; 207 KB

 Malaga Transmission-hazard.-Percentage-of-Covid--19-cases 2020 map 17732 eng.jpg Usr17
10:02, 31 May 2022
874 × 618; 155 KB
 Malaga Risk-of-Covid--19-transmission 2020 map 17738 eng.jpg Usr17
10:02, 31 May 2022
874 × 618; 123 KB
 Malaga Population-density-and-Covid--19-hotspots 2020 map 17733 eng.jpg Usr17
10:02, 31 May 2022
874 × 618; 152 KB
 Malaga Infection-hazard.-Number-of-Covid--19-cases 2020 map 17731 eng.jpg Usr17
10:02, 31 May 2022
874 × 618; 123 KB

 Madrid Social-benefits-in-the-city-of-Madrid 2018 map 17773 eng.jpg Usr17
10:02, 31 May 2022
709 × 756; 74 KB
 Madrid COVID--19-cases-in-the-Region-of-Madrid 2020 map 17918 eng.jpg Usr17
10:02, 31 May 2022
933 × 685; 131 KB
 Madrid COVID--19-cases-in-the-city-of-Madrid 2020 map 17919 eng.jpg Usr17
10:02, 31 May 2022
709 × 756; 92 KB


.-Valladolid_2019-2020_statisticalgraph_18439_eng.jpg)
-Toledo_2019-2020_statisticalgraph_18437_eng.jpg)
-Madrid_2019-2020_statisticalgraph_18431_eng.jpg)
.-Valencia_2019-2020_statisticalgraph_18438_eng.jpg)
.-Seville_2019-2020_statisticalgraph_18436_eng.jpg)
.-Saragossa_2019-2020_statisticalgraph_18440_eng.jpg)
.-Murcia_2019-2020_statisticalgraph_18433_eng.jpg)
.-Malaga_2019-2020_statisticalgraph_18432_eng.jpg)
.-La-Rioja_2019-2020_statisticalgraph_18430_eng.jpg)
.-Corunna_2019-2020_statisticalgraph_18429_eng.jpg)
.-Cantabria_2019-2020_statisticalgraph_18435_eng.jpg)
.-Burgos_2019-2020_statisticalgraph_18428_eng.jpg)
.-Barcelona_2019-2020_statisticalgraph_18426_eng.jpg)
.-Badajoz_2019-2020_statisticalgraph_18427_eng.jpg)
.-Asturias_2019-2020_statisticalgraph_18434_eng.jpg)
.-Alicante_2019-2020_statisticalgraph_18420_eng.jpg)


