Most linked-to files
Showing below up to 50 results in range #251 to #300.
View (previous 50 | next 50) (20 | 50 | 100 | 250 | 500)
 Spain Evolution-in-greenhouse-gas-emissions-and-estimation-of-emissions-without-COVID--19 2018-2020 statisticalgraph 18613 eng.jpg Used on 3 pages
1,083 × 778; 164 KB
 Athens Evolution-of-NO2-air-pollution-in-Athens 2019-2020 statisticalgraph 18606 eng.jpg Used on 3 pages
709 × 709; 119 KB
 Spain Evolution-in-the-average-daily-traffic-flow-(ADTF).-Badajoz 2019-2020 statisticalgraph 18427 eng.jpg Used on 3 pages
1,299 × 1,252; 269 KB
 Europe Evolution-of-COVID--19-cases-in-the-European-Union 2020 statisticalgraph 17795 eng.jpg Used on 3 pages
1,299 × 933; 190 KB
 Spain Evolution-in-the-public-expenditure-of-the-National-Administration 2015-2020 statisticalgraph 18388 eng.jpg Used on 3 pages
1,299 × 933; 159 KB
 Spain Fall-in-intra--provincial-mobility.-Lockdown-–-week-1 2020 map 18239 eng.jpg Used on 3 pages
709 × 526; 76 KB
 Prague Evolution-of-NO2-air-pollution-in-Prague 2019-2020 statisticalgraph 18600 eng.jpg Used on 3 pages
709 × 709; 116 KB
 Spain Interventions-under-Operation-Balmis-by-location 2020 statisticalgraph 18378 eng.jpg Used on 3 pages
689 × 1,043; 83 KB
 Spain Amount-of-benefits-from-the-Regional-Minimum-Income 2020 map 18564 eng.jpg Used on 3 pages
709 × 526; 89 KB

 Spain Evolution-in-revenue-from-Value-Added-Tax-(VAT) 2010-2020 statisticalgraph 18335 eng.jpg Used on 3 pages
1,083 × 778; 142 KB
 Spain Evolution-in-the-average-daily-traffic-flow-(ADTF).-Valladolid 2019-2020 statisticalgraph 18439 eng.jpg Used on 3 pages
1,299 × 1,252; 296 KB

 Galicia COVID--19-cases-in-the-municipality-of-A-Coruna 2020 map 17888 eng.jpg Used on 3 pages
874 × 783; 119 KB
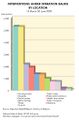
 Spain Evolution-of-hospital-admissions-due-to-Covid--19-during-the-downscaling-process 2020 statisticalgraph 18135 eng.jpg Used on 3 pages
708 × 807; 121 KB

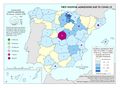 Spain First-hospital-admissions-due-to-COVID--19 2020 map 17957 eng.jpg Used on 3 pages
933 × 685; 116 KB
 Seville Evolution-in--water-consumption-by-households-in-the-city-of-Seville 2019-2020 statisticalgraph 18618 eng.jpg Used on 3 pages
1,083 × 778; 114 KB
 Spain Beneficiaries-of-the-Minimun-Subsistence-Income 2020-2021 map 18559 eng.jpg Used on 3 pages
933 × 685; 144 KB
 Spain Deaths-from-COVID--19-over-80-years-of-age-during-the-first-wave-of-the-pandemic 2020 map 18076 eng.jpg Used on 3 pages
709 × 526; 97 KB
 Spain Public-expenditure-of-the-regional-administrations-per-capita 2020 map 18390 eng.jpg Used on 3 pages
709 × 526; 64 KB
 Spain Tax-revenue-for-the-public-treasury 2019-2020 map 18325 eng.jpg Used on 3 pages
933 × 685; 99 KB

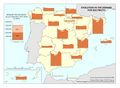
 Spain Fall-in-inter--provincial-mobility.-Downscaling-scheme-–-week-3 2020 map 18254 eng.jpg Used on 3 pages
709 × 526; 78 KB
 North-Atlantic Surface-pressure-chart-during-the-pandemic 2020 map 18384 eng.jpg Used on 3 pages
709 × 525; 129 KB
 Spain Hospital-beds-according-to-membership 2019 map 18609 eng.jpg Used on 3 pages
1,388 × 1,016; 191 KB
 Spain Admissions-to-the-Intensive-Care-Units-due-to-Covid--19-during-the-rising-phase-of-the-pandemic 2020 map 18031 eng.jpg Used on 3 pages
709 × 526; 98 KB
 Spain Companies-deemed-as-being-essential 2019 map 17790 eng.jpg Used on 3 pages
1,388 × 1,016; 226 KB

 Spain People-assisted-by-the-Spanish-Red-Cross-during-the-first-wave-of-the-pandemic 2020 statisticalgraph 18476 eng.jpg Used on 3 pages
709 × 709; 90 KB
 Spain Evolution-in-greenhouse-gas-emissions-by-category 2018-2020 statisticalgraph 18612 eng.jpg Used on 3 pages
1,083 × 778; 162 KB
 Spain Reported-prevalence-of-COPD-in-the-population-over-15-years-of-age 2017 map 17860 eng.jpg Used on 3 pages
709 × 526; 71 KB
 Spain Evolution-in-the-average-daily-traffic-flow-(ADTF).-Barcelona 2019-2020 statisticalgraph 18426 eng.jpg Used on 3 pages
1,299 × 1,252; 272 KB
 Spain Evolution-in-the-services-sector-activity-indicators 2018-2020 statisticalgraph 17802 eng.jpg Used on 3 pages
1,299 × 933; 214 KB
 World Evolution-in-the-number-of-deaths-from-COVID--19-worldwide 2020 statisticalgraph 17715 eng.jpg Used on 3 pages
1,083 × 778; 143 KB
 Spain Fall-in-intra--provincial-mobility.-Lockdown-–-week-2 2020 map 18240 eng.jpg Used on 3 pages
709 × 526; 74 KB
 Spain Interventions-under-Operation-Balmis-by-type 2020 statisticalgraph 18379 eng.jpg Used on 3 pages
689 × 1,043; 73 KB


 Spain Evolution-in-sales-index-and-occupancy-rate-in-retail-trade 2019-2020 statisticalgraph 18588 eng.jpg Used on 3 pages
1,298 × 850; 161 KB
 Spain Evolution-in-the-demand-for-electricity 2019-2020 map 18621 eng.jpg Used on 3 pages
933 × 685; 97 KB
 Galicia COVID--19-cases-in-the-municipality-of-Vigo 2020 map 17889 eng.jpg Used on 3 pages
874 × 588; 91 KB


.-Badajoz_2019-2020_statisticalgraph_18427_eng.jpg)


_2010-2020_statisticalgraph_18335_eng.jpg)
.-Valladolid_2019-2020_statisticalgraph_18439_eng.jpg)


.-Barcelona_2019-2020_statisticalgraph_18426_eng.jpg)


