Most linked-to files
Showing below up to 50 results in range #301 to #350.
View (previous 50 | next 50) (20 | 50 | 100 | 250 | 500)
 Spain Households-in-poverty-receiving-regional-minimum-income-benefits 2019 map 18210 eng.jpg Used on 3 pages
709 × 526; 65 KB
 Spain Age--sex-pyramid-of-the-deceased-from-COVID--19-during-the-downward-phase-of-the-pandemic 2020 statisticalgraph 18071 eng.jpg Used on 3 pages
1,299 × 933; 150 KB
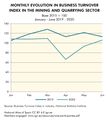 Spain Monthly-evolution-in-Business-Turnover-Index-in-the-mining-and-quarrying-sector 2019-2020 statisticalgraph 18487 eng.jpg Used on 3 pages
850 × 932; 109 KB

 Spain Public-expenditure-of-the-regional-administrations-per-capita 2020 map 18390 eng.jpg Used on 3 pages
709 × 526; 64 KB

 Spain Tax-revenue-for-the-public-treasury 2019-2020 map 18325 eng.jpg Used on 3 pages
933 × 685; 99 KB
 China Origins-and-spread-of-Covid--19-in-China 2020 map 17842 eng.jpg Used on 3 pages
933 × 685; 123 KB
 Spain Evolution-in-the-number-of-deaths-from-covid--19-during-the-downscaling-process 2020 statisticalgraph 18137 eng.jpg Used on 3 pages
708 × 807; 140 KB
 Spain Fall-in-inter--provincial-mobility.-Lockdown-–-week-3. 2020 map 18250 eng.jpg Used on 3 pages
709 × 526; 75 KB
 Paris Evolution-of-NO2-air-pollution-in-Paris 2019-2020 statisticalgraph 18599 eng.jpg Used on 3 pages
709 × 709; 122 KB
 Saragossa Emotional-conditions-during-lockdown.-City-of-Zaragoza 2020 map 18154 eng.jpg Used on 3 pages
650 × 467; 90 KB

 Spain Beds-in-medicalised-hotels-during-the-first-wave-of-the-pandemic 2020 map 18514 eng.jpg Used on 3 pages
709 × 526; 74 KB

 Spain People-assisted-by-the-Spanish-Red-Cross-during-the-first-wave-of-the-pandemic 2020 statisticalgraph 18476 eng.jpg Used on 3 pages
709 × 709; 90 KB

 Spain Reported-prevalence-of-COPD-in-the-population-over-15-years-of-age 2017 map 17860 eng.jpg Used on 3 pages
709 × 526; 71 KB
 Spain Evolution-in-petroleum-product-consumption 2019-2020 statisticalgraph 18579 eng.jpg Used on 3 pages
1,456 × 1,043; 163 KB
 Barcelona Evolution-in-the-average-daily-temperature-in-February-in-Barcelona-(airport) 1981-2020 statisticalgraph 18406 eng.jpg Used on 3 pages
709 × 709; 120 KB
 Spain Evolution-in-the-average-daily-traffic-flow-(ADTF).-La-Rioja 2019-2020 statisticalgraph 18430 eng.jpg Used on 3 pages
1,299 × 1,252; 279 KB
 Europe Population-density-in-the-European-Union 2019 map 18193 eng.jpg Used on 3 pages
933 × 1,016; 182 KB
 World Evolution-in-the-number-of-deaths-from-COVID--19-worldwide 2020 statisticalgraph 17715 eng.jpg Used on 3 pages
1,083 × 778; 143 KB
 Spain Evolution-of-COVID--19-cases-during-the-rising-phase-of-the-pandemic 2020 statisticalgraph 17965 eng.jpg Used on 3 pages
1,083 × 778; 127 KB
 Spain Fall-in-mobility-during-the-third-week-of-lockdown 2020 map 18366 eng.jpg Used on 3 pages
709 × 526; 78 KB
 Spain Healthcare-workers-infected-with-COVID--19-during-the-first-wave-of-the-pandemic 2020 map 18075 eng.jpg Used on 3 pages
709 × 526; 98 KB


 Spain Evolution-in-the-amount-of-employed-by-economic-sector 2018-2020 statisticalgraph 17785 eng.jpg Used on 3 pages
1,299 × 933; 167 KB
 Barcelona Synthetic-vulnerability-index.-City-of-Barcelona 2017 map 18011 eng.jpg Used on 3 pages
1,388 × 1,016; 169 KB
 Spain Evolution-in-the-number-of-Conferences-of-Presidents 2004-2020 statisticalgraph 18522 eng.jpg Used on 3 pages
709 × 965; 106 KB


 Spain Households-receiving-Regional-Minimum-Income-benefits 2019 map 18209 eng.jpg Used on 3 pages
709 × 526; 66 KB
 Spain Age--sex-pyramid-of-the-deceased-from-COVID--19-during-the-first-wave-of-the-pandemic 2020 statisticalgraph 18079 eng.jpg Used on 3 pages
1,083 × 778; 130 KB
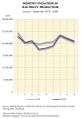 Spain Monthly-evolution-in-electricity-production 2019-2020 statisticalgraph 18576 eng.jpg Used on 3 pages
709 × 1,043; 103 KB
 Spain Change-in-the-number-of-deaths.-First-26-weeks-2020-compared-to-the-same-weeks-in-2019 2019 map 18176 eng.jpg Used on 3 pages
933 × 685; 118 KB

 Spain Deaths.-Average-March--June-2017--2019 2017-2019 map 18162 eng.jpg Used on 3 pages
933 × 685; 112 KB
 Spain Quarterly-evolution-in-the-amount-of-employed-in-tourism-during-the-pandemic 2019-2020 map 18231 eng.jpg Used on 3 pages
933 × 685; 112 KB
 Spain Evolution-in-CO2--equivalent-emissions-related-to-electricity-production 2018-2020 statisticalgraph 18605 eng.jpg Used on 3 pages
1,083 × 778; 154 KB
 Spain Evolution-in-the-amount-of-workers-affiliated-to-the-Social-Security-system 2019-2020 statisticalgraph 18359 eng.jpg Used on 3 pages
1,554 × 738; 143 KB
 Spain Evolution-in-the-number-of-deaths.-January----June-2017----2020 2017-2020 statisticalgraph 18164 eng.jpg Used on 3 pages
728 × 846; 127 KB


_1981-2020_statisticalgraph_18406_eng.jpg)
.-La-Rioja_2019-2020_statisticalgraph_18430_eng.jpg)


