Most linked-to files
Showing below up to 50 results in range #351 to #400.
View (previous 50 | next 50) (20 | 50 | 100 | 250 | 500)
 Spain Noise-pollution-in-Madrid-during-lockdown 2019-2020 statisticalgraph 18617 eng.jpg Used on 3 pages
1,299 × 933; 206 KB
 Spain Fall-in-intra--provincial-mobility.-Downscaling-process-–-week-1 2020 map 18244 eng.jpg Used on 3 pages
709 × 526; 76 KB

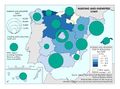
 Spain Monthly-evolution-in-registered-unemployed-in-sales--services-and-trade-during-the-pandemic 2019-2020 map 18529 eng.jpg Used on 3 pages
709 × 526; 77 KB
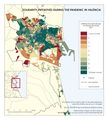 Valencia Solidarity-initiatives-during-the-pandemic.-Valencia 2020 map 18466 eng.jpg Used on 3 pages
709 × 779; 118 KB

 Spain Evolution-in-acceptances-of-inheritance-deeds-during-the-pandemic 2019-2020 statisticalgraph 18536 eng.jpg Used on 3 pages
850 × 850; 120 KB
 Spain Evolution-in-registered-unemployment 2015-2020 statisticalgraph 17839 eng.jpg Used on 3 pages
1,456 × 1,043; 144 KB
 Spain Evolution-in-the-average-daily-traffic-flow-(ADTF).-Saragossa 2019-2020 statisticalgraph 18440 eng.jpg Used on 3 pages
1,299 × 1,252; 289 KB
 Spain Evolution-of-e--commerce-turnover-during-the-pandemic 2019-2020 statisticalgraph 18534 eng.jpg Used on 3 pages
1,299 × 933; 138 KB
 Madrid Synthetic-vulnerability-index.-City-of-Madrid 2017 map 18012 eng.jpg Used on 3 pages
1,388 × 1,016; 179 KB

 Spain Female-beneficiaries-of-Active-Insertion-Income-by-group 2020 statisticalgraph 18571 eng.jpg Used on 3 pages
709 × 679; 94 KB
 Saragossa Variation-in-home-office-during-lockdown.-City-of-Zaragoza 2020 map 18153 eng.jpg Used on 3 pages
650 × 467; 90 KB
 Spain Requests-for-assistance-from-Caritas-during-the-first-wave-of-the-pandemic 2020 statisticalgraph 18478 eng.jpg Used on 3 pages
709 × 709; 95 KB
 Spain Beneficiaries-of-the-Active-Insertion-Income-by-age 2020 map 18567 eng.jpg Used on 3 pages
933 × 685; 131 KB
 Spain Tweets-including-solidarity-hashtags-during-the-first-wave-of-the-pandemic 2020 map 18473 eng.jpg Used on 3 pages
709 × 526; 79 KB
 World Evolution-of-COVID--19-cases-worldwide 2020 statisticalgraph 17714 eng.jpg Used on 3 pages
1,083 × 778; 181 KB

 Spain Evolution-in-the-amount-of-households-with-no-income 2005-2020 statisticalgraph 17864 eng.jpg Used on 3 pages
1,299 × 933; 174 KB
 Bilbao Evolution-in-the-average-daily-temperature-in-February-in-Bilbao-(airport) 1981-2020 statisticalgraph 18408 eng.jpg Used on 3 pages
709 × 709; 122 KB
 Spain Evolution-in-the-number-of-Social-Service-Sector-Conferences 2009-2020 statisticalgraph 18524 eng.jpg Used on 3 pages
1,083 × 778; 126 KB
 Granada Evolution-in-seismic-noise-recorded-by-stations-from-the-National-Seismic-Network.-Granada 2020 statisticalgraph 18629 eng.jpg Used on 3 pages
1,083 × 778; 214 KB
 Milan Evolution-of-NO2-air-pollution-in-Milan 2019-2020 statisticalgraph 18598 eng.jpg Used on 3 pages
709 × 709; 120 KB
 Spain Prevalence-of-obesity-in-the-population-over-18-years-of-age 2017 map 17861 eng.jpg Used on 3 pages
709 × 526; 84 KB
 Spain Hospital-admissions-due-to-COVID--19-during-the-downward-phase-of-the-pandemic 2020 map 18036 eng.jpg Used on 3 pages
709 × 526; 99 KB
 Spain Messages-on-twitter-in-solidarity-with-the-provisional-Hospital-at-Madrid-Trade-Fair 2020 statisticalgraph 18518 eng.jpg Used on 3 pages
1,083 × 778; 171 KB
 Spain COVID--19-cases-during-the-first-wave-of-the-pandemic 2020 map 18072 eng.jpg Used on 3 pages
709 × 526; 100 KB
 Spain Deaths-from-COVID--19-during-the-first-wave-of-the-pandemic 2020 map 18074 eng.jpg Used on 3 pages
709 × 526; 93 KB
 Spain Evolution-in-the-average-daily-traffic-flow-(ADTF).-Alicante 2019-2020 statisticalgraph 18420 eng.jpg Used on 3 pages
1,299 × 1,252; 275 KB
 Spain Evolution-in-the-number-of-travellers--km-during-the-first-wave-of-the-pandemic 2020 statisticalgraph 18368 eng.jpg Used on 3 pages
1,457 × 778; 200 KB
 London Evolution-of-NO2-air-pollution-in-London 2019-2020 statisticalgraph 18608 eng.jpg Used on 3 pages
709 × 709; 117 KB
 Spain Fall-in-intra--provincial-mobility.-Downscaling-process-–-week-3 2020 map 18245 eng.jpg Used on 3 pages
709 × 526; 76 KB


 Spain Monthly-evolution-in-rural-accommodation-occupancy-during-the-pandemic 2019-2020 map 18234 eng.jpg Used on 3 pages
933 × 685; 114 KB
 Valladolid Monthly-evolution-in-ultraviolet-radiation-in-Valladolid 2019-2020 statisticalgraph 18421 eng.jpg Used on 3 pages
1,082 × 728; 176 KB

 Spain Evolution-in-companies-established-and-dissolved 2018-2020 statisticalgraph 17788 eng.jpg Used on 3 pages
1,299 × 933; 195 KB
 Spain Evolution-in-revenue-from-Corporate-Income-Tax-(CIT 2010-2020 statisticalgraph 18337 eng.jpg Used on 3 pages
1,299 × 933; 164 KB
 Spain Evolution-in-the-average-daily-traffic-flow-(ADTF).-Seville 2019-2020 statisticalgraph 18436 eng.jpg Used on 3 pages
1,299 × 1,252; 276 KB
 Spain Evolution-of-hospital-admissions-due-to-COVID--19-during-the-rising-phase-of-the-pandemic 2020 statisticalgraph 17978 eng.jpg Used on 3 pages
1,083 × 778; 131 KB
 Spain Population-leaving-their-mobility-area-during-the-first-wave-of-the-pandemic 2020 statisticalgraph 18256 eng.jpg Used on 3 pages
1,457 × 778; 145 KB

 Saragossa Variation-in-spending-on-television-subscriptions-during-lockdown.-City-of-Zaragoza 2020 map 18155 eng.jpg Used on 3 pages
650 × 467; 90 KB
 Spain Revenue-from-Corporate-Income-Tax-(CIT) 2019-2020 map 18328 eng.jpg Used on 3 pages
709 × 526; 81 KB


.-Saragossa_2019-2020_statisticalgraph_18440_eng.jpg)


_1981-2020_statisticalgraph_18408_eng.jpg)


.-Alicante_2019-2020_statisticalgraph_18420_eng.jpg)


.-Seville_2019-2020_statisticalgraph_18436_eng.jpg)


_2019-2020_map_18328_eng.jpg)