Difference between revisions of "Talk:Labour market (COVID-19 monograph)"
| (31 intermediate revisions by 2 users not shown) | |||
| Line 1: | Line 1: | ||
| − | {{ANEEtiqueta|palabrasclave=pandemia, covid19, | + | {{ANEEtiqueta|palabrasclave=pandemia, covid19, companies using furlough schemes, furlough schemes, employment contracts during the pandemic, home office during the pandemic, workers affiliated to the Social Security System during the first wave of the pandemic, unemployment, beneficiaries of unemployment, households with all active members are unemployment, households income, national Minimum Subsistence Income |descripcion=Analysis of the labour market through statistical maps and graphs from the National Atlas of Spain.|url=valor}}{{ANEObra|Serie=Monographs from the National Atlas of Spain|Logo=[[File:Logo_Monografía.jpg|left|50x50px|link=]]|Título=The COVID-19 pandemic in Spain|Subtítulo=First wave: from the first cases to the end of June 2020|Año=2021|Contenido=New content}} |
{{ANENavegacionCapitulo (monografía COVID-19)|estructura=[[Estructura temática (monografía COVID-19)|Estructura temática]]|seccion=[[Social,_economic_and_environmental_effects|Social, economic and environmental effects]]|capitulo=Labour market}} | {{ANENavegacionCapitulo (monografía COVID-19)|estructura=[[Estructura temática (monografía COVID-19)|Estructura temática]]|seccion=[[Social,_economic_and_environmental_effects|Social, economic and environmental effects]]|capitulo=Labour market}} | ||
| + | {{ANENavegacionHermanos |anterior=[[Economic_indicators_and_productive_sectors|Economic indicators and productive sectors]] |siguiente=[[Public_finance_(COVID-19_monograph)|Public finance]] }} | ||
| + | |||
| + | [[File:Spain_Evolution-in-the-amount-of-workers-affiliated-to-the-Social-Security-system_2019-2020_statisticalgraph_18359_eng.jpg|right|thumb|300px|Statistical graph: Evolution in the amount of workers affiliated to the Social Security system. 2019-2020. Spain.]] | ||
| − | |||
Assessing the labour market becomes crucial when rating an economy, its dynamism, the social welfare and the income level of the population. The labour market is made up of people, some of whom offer their labour in exchange for a salary that enables them to live, and some of whom demand this labour to produce the goods they sell and are willing to pay these salaries in return. | Assessing the labour market becomes crucial when rating an economy, its dynamism, the social welfare and the income level of the population. The labour market is made up of people, some of whom offer their labour in exchange for a salary that enables them to live, and some of whom demand this labour to produce the goods they sell and are willing to pay these salaries in return. | ||
| + | |||
The Spanish labour market has some unique characteristics that make it highly vulnerable to any negative impact, such as the COVID-19 pandemic. The relationship between supply and demand for labour suffered a major downturn in Spain in March 2020 that had a heavy impact on the behaviour of the main indicators on the labour market and utterly modified the trends seen before the setback. | The Spanish labour market has some unique characteristics that make it highly vulnerable to any negative impact, such as the COVID-19 pandemic. The relationship between supply and demand for labour suffered a major downturn in Spain in March 2020 that had a heavy impact on the behaviour of the main indicators on the labour market and utterly modified the trends seen before the setback. | ||
| − | The amount of workers affiliated to the Social Security system is an indicator on the capacity of the labour market to grow or reduce formal employment. The amount of affiliated workers followed the usual patterns throughout 2019, as may observed on the graph on the Evolution in the amount of workers affiliated to the Social Security system, i.e. starting from a low level in January and then steadily rising in the months leading up to the summer period, after which it remained virtually stagnant, except for slight reductions towards the end of August and December. This pattern is indicative of the seasonality of the Spanish economy and is more evident in the General Scheme of the Social Security system than in the Special Scheme for Self-Employed Workers. | + | The amount of workers affiliated to the Social Security system is an indicator on the capacity of the labour market to grow or reduce formal employment. The amount of affiliated workers followed the usual patterns throughout 2019, as may observed on the graph on the [[:File:Spain_Evolution-in-the-amount-of-workers-affiliated-to-the-Social-Security-system_2019-2020_statisticalgraph_18359_eng.jpg| ''Evolution in the amount of workers affiliated to the Social Security system'']], i.e. starting from a low level in January and then steadily rising in the months leading up to the summer period, after which it remained virtually stagnant, except for slight reductions towards the end of August and December. This pattern is indicative of the seasonality of the Spanish economy and is more evident in the General Scheme of the Social Security system than in the Special Scheme for Self-Employed Workers. |
<div><ul style="text-align: left; float:left; margin-left:0px; margin-right:0px"> | <div><ul style="text-align: left; float:left; margin-left:0px; margin-right:0px"> | ||
<li style="display: inline-block; vertical-align:top"> | <li style="display: inline-block; vertical-align:top"> | ||
| − | [[File: | + | [[File:Spain_Workers-affiliated-to-the-Social-Security-System_2018-2019_map_17823_eng.jpg|left|thumb|300px|Map: Workers affiliated to the Social Security System. 2018-2019. Spain. [//centrodedescargas.cnig.es/CentroDescargas/busquedaRedirigida.do?ruta=PUBLICACION_CNIG_DATOS_VARIOS/aneTematico/Spain_Workers-affiliated-to-the-Social-Security-System_2018-2019_map_17823_eng.pdf PDF]. [//centrodedescargas.cnig.es/CentroDescargas/busquedaRedirigida.do?ruta=PUBLICACION_CNIG_DATOS_VARIOS/aneTematico/Spain_Workers-affiliated-to-the-Social-Security-System_2018-2019_map_17823_eng.zip Data]. [//interactivo-atlasnacional.ign.es/index.php#c=indicator&i=s17823.s17823&i2=c12229.c12229&t=A02&t2=A03&view=map9 Interactive version].]] |
</li> | </li> | ||
<li style="display: inline-block; vertical-align: top"> | <li style="display: inline-block; vertical-align: top"> | ||
| − | [[File: | + | [[File:Spain_Workers-affiliated-to-the-Social-Security-system-during-the-first-wave-of-the-pandemic_2019-2020_map_17824_eng.jpg|left|thumb|300px|Map: Workers affiliated to the Social Security system during the first wave of the pandemic. 2019-2020. Spain. [//centrodedescargas.cnig.es/CentroDescargas/busquedaRedirigida.do?ruta=PUBLICACION_CNIG_DATOS_VARIOS/aneTematico/Spain_Workers-affiliated-to-the-Social-Security-system-during-the-first-wave-of-the-pandemic_2019-2020_map_17824_eng.pdf PDF]. [//centrodedescargas.cnig.es/CentroDescargas/busquedaRedirigida.do?ruta=PUBLICACION_CNIG_DATOS_VARIOS/aneTematico/Spain_Workers-affiliated-to-the-Social-Security-system-during-the-first-wave-of-the-pandemic_2019-2020_map_17824_eng.zip Data]. [//interactivo-atlasnacional.ign.es/index.php#c=indicator&i=s17824.s17824&i2=c12235.c12235&t=A02&t2=A03&view=map9 Interactive version].]] |
</li> | </li> | ||
</ul></div>This pattern continued towards the beginning of 2020, but was suddenly interrupted by the state of alarm on 14 March, which brought all ‘non-essential economic activities’ to a halt. This had a major impact on the amount of workers affiliated to the Social Security system. From 14 to 31 March, affiliations plummeted. The Social Security system lost 898,822 affiliated workers in just one month, of which 855,081 were affiliated to the General Scheme (equivalent to a drop of 5.63%) and 40,877 to the Special Scheme for Self-Employed Workers (equivalent to a reduction of 1.25%). | </ul></div>This pattern continued towards the beginning of 2020, but was suddenly interrupted by the state of alarm on 14 March, which brought all ‘non-essential economic activities’ to a halt. This had a major impact on the amount of workers affiliated to the Social Security system. From 14 to 31 March, affiliations plummeted. The Social Security system lost 898,822 affiliated workers in just one month, of which 855,081 were affiliated to the General Scheme (equivalent to a drop of 5.63%) and 40,877 to the Special Scheme for Self-Employed Workers (equivalent to a reduction of 1.25%). | ||
| Line 21: | Line 24: | ||
<div><ul style="text-align: center> | <div><ul style="text-align: center> | ||
| − | <div><ul style="text-align: left; margin- | + | <div><ul style="text-align: left; margin-top: 0>{{ANETextoAsociado49|titulo=EMPLOYMENT CONTRACTS|contenido=[[File:Spain_Employment-contracts-during-the-pandemic_2019-2020_map_18159_eng.jpg|right|thumb|300px|Map: Employment contracts during the pandemic. 2019-2020. Spain. [//centrodedescargas.cnig.es/CentroDescargas/busquedaRedirigida.do?ruta=PUBLICACION_CNIG_DATOS_VARIOS/aneTematico/Spain_Employment-contracts-during-the-pandemic_2019-2020_map_18159_eng.pdf PDF]. [//centrodedescargas.cnig.es/CentroDescargas/busquedaRedirigida.do?ruta=PUBLICACION_CNIG_DATOS_VARIOS/aneTematico/Spain_Employment-contracts-during-the-pandemic_2019-2020_map_18159_eng.zip Data]. [//interactivo-atlasnacional.ign.es/index.php#c=indicator&i=s18159.s18159&i2=c12635.c12635&t=A01&t2=A02&view=map10 Interactive version].]] |
| − | The drop in the amount of workers affiliated to the Social Security system who had temporary contracts (-17.30%) was much sharper than amongst those with permanent contracts (-1.92%). However, new contracts were signed in all regions, most of them temporary, as shown on the map on Employment Contracts during the pandemic. This map depicts the amount of employment contracts -both temporary and permanent- registered in the National Public Employment Service throughout the first wave of the pandemic. The variation in the amount of new contracts signed in 2020 in relation to those signed in the same period in 2019 is shown on the choropleth. The downturn in the labour market explains why this variation was negative in all regions, although not to the same degree. New contracts fell the most in the Balearic Islands (Illes Balears) (-72.3%), followed by the Canary Islands (Canarias) and some regions in northern Spain, with a negative variation ranging from -50% to -60%. Andalusia (Andalucía), the Region of Valencia (Comunitat Valenciana), Aragón, Navarre (Navarra) and La Rioja registered slightly lower decreases, of -40% to -50%. Falls registered in Extremadura and Castile-La Mancha (Castilla-La Mancha) were around -30% to -40%. Only in the Region of Murcia (Región de Murcia) was the fall somewhat lower (-28.5%).}} | + | The drop in the amount of workers affiliated to the Social Security system who had temporary contracts (-17.30%) was much sharper than amongst those with permanent contracts (-1.92%). However, new contracts were signed in all regions, most of them temporary, as shown on the map on [[:File:Spain_Employment-contracts-during-the-pandemic_2019-2020_map_18159_eng.jpg| ''Employment Contracts during the pandemic'']]. This map depicts the amount of employment contracts -both temporary and permanent- registered in the National Public Employment Service throughout the first wave of the pandemic. The variation in the amount of new contracts signed in 2020 in relation to those signed in the same period in 2019 is shown on the choropleth. The downturn in the labour market explains why this variation was negative in all regions, although not to the same degree. New contracts fell the most in the Balearic Islands (Illes Balears) (-72.3%), followed by the Canary Islands (Canarias) and some regions in northern Spain, with a negative variation ranging from -50% to -60%. Andalusia (Andalucía), the Region of Valencia (Comunitat Valenciana), Aragón, Navarre (Navarra) and La Rioja registered slightly lower decreases, of -40% to -50%. Falls registered in Extremadura and Castile-La Mancha (Castilla-La Mancha) were around -30% to -40%. Only in the Region of Murcia (Región de Murcia) was the fall somewhat lower (-28.5%).}} |
| − | <ul style="text-align: left; margin-top: 0>{{ | + | <ul style="text-align: left; margin-top: 0>{{ANETextoAsociado49|titulo=HOME OFFICE|contenido=[[File:Spain_Home-office-during-the-pandemic_2020_map_18158_eng.jpg|right|thumb|300px|Map: Home office during the pandemic. 2020. Spain. [//centrodedescargas.cnig.es/CentroDescargas/busquedaRedirigida.do?ruta=PUBLICACION_CNIG_DATOS_VARIOS/aneTematico/Spain_Home-office-during-the-pandemic_2020_map_18158_eng.pdf PDF]. [//centrodedescargas.cnig.es/CentroDescargas/busquedaRedirigida.do?ruta=PUBLICACION_CNIG_DATOS_VARIOS/aneTematico/Spain_Home-office-during-the-pandemic_2020_map_18158_eng.zip Data]. Interactive versions [//interactivo-atlasnacional.ign.es/index.php#c=indicator&i=c12629.c12629&t=A02&view=map10 1] [//interactivo-atlasnacional.ign.es/index.php#c=indicator&i=c12630.c12630&t=A02&view=map10 2] [//interactivo-atlasnacional.ign.es/index.php#c=indicator&i=c12631.c12631&t=A02&view=map10 3].]] |
Many companies and public administrations could only continue their activity during lockdown in spring 2020 by allowing their employees to work from home. A previously scarcely used labour format became almost overnight a large-scale experiment to test the possibilities offered by this way of managing the production process. According to the Labour Force Survey, at least 20% of employees in Spain were in home office during this period. | Many companies and public administrations could only continue their activity during lockdown in spring 2020 by allowing their employees to work from home. A previously scarcely used labour format became almost overnight a large-scale experiment to test the possibilities offered by this way of managing the production process. According to the Labour Force Survey, at least 20% of employees in Spain were in home office during this period. | ||
Figures highlight significant differences by region and sex. From a spatial point of view, the Region of Madrid (Comunidad de Madrid) stands out, as over 30% of employees were in home office. This contrasts with the Canary Islands (Canarias), La Rioja, Navarre (Navarra) and the Region of Murcia (Región de Murcia) where only under 15% of employees worked from home. In terms of gender, more women than men were in home office in most of the regions, especially in Aragón, Extremadura and the town of Melilla. | Figures highlight significant differences by region and sex. From a spatial point of view, the Region of Madrid (Comunidad de Madrid) stands out, as over 30% of employees were in home office. This contrasts with the Canary Islands (Canarias), La Rioja, Navarre (Navarra) and the Region of Murcia (Región de Murcia) where only under 15% of employees worked from home. In terms of gender, more women than men were in home office in most of the regions, especially in Aragón, Extremadura and the town of Melilla. | ||
| Line 32: | Line 35: | ||
}}</ul></ul></div> | }}</ul></ul></div> | ||
</ul></div> | </ul></div> | ||
| + | |||
{{ANESubirArriba}} | {{ANESubirArriba}} | ||
| − | {{ANETextoEpigrafe|epigrafe= | + | {{ANETextoEpigrafe|epigrafe=Registered unemployment}} |
| + | |||
| − | [[File: | + | [[File:Spain_Evolution-in-registered-unemployment_2015-2020_statisticalgraph_17839_eng.jpg|right|thumb|300px|Statistical graph: Evolution in registered unemployment. 2015-2020. Spain.]] |
| + | One of the immediate effects of the health crisis on the labour market was that many people were unable to carry out the tasks they usually performed. Countless people saw their economic activity suspended by the economic shutdown following the state of alarm on 14 March, with exceptions only being made for activities that were considered ‘essential’. As restrictions were gradually loosened in May and June, some workers were able to return to work, yet many others were not. This second group included those whose companies made use of the exceptional measures put in place by the national government through the Coronavirus Job Retention Scheme (agreed upon by employers and unions and approved in Parliament), which allowed employers to reduce working hours and even suspend contracts. Also in this group were those unable to return to work, either because the company could not withstand the temporary shutdown and folded or because the company adjusted its workforce once economy opened again, what made some employees redundant. | ||
| − | [[File: | + | [[File:Spain_Registered-unemployment-by-sex-and-age_2018-2019_map_17837_eng.jpg|left|thumb|300px|Map: Registered unemployment by sex and age. 2018-2019. Spain. [//centrodedescargas.cnig.es/CentroDescargas/busquedaRedirigida.do?ruta=PUBLICACION_CNIG_DATOS_VARIOS/aneTematico/Spain_Registered-unemployment-by-sex-and-age_2018-2019_map_17837_eng.pdf PDF]. [//centrodedescargas.cnig.es/CentroDescargas/busquedaRedirigida.do?ruta=PUBLICACION_CNIG_DATOS_VARIOS/aneTematico/Spain_Registered-unemployment-by-sex-and-age_2018-2019_map_17837_eng.zip Data]. Interactive versions [//interactivo-atlasnacional.ign.es/index.php#c=indicator&i=s17837_a.s17837_a&i2=c12242.c12242&t=A02&t2=A03&view=map10 1] [//interactivo-atlasnacional.ign.es/index.php#c=indicator&i=s17837_b.s17837_b&i2=c12242.c12242&t=A02&t2=A03&view=map10 2] .]] |
| − | [[File: | + | [[File:Spain_Registered-unemployment-by-sex-and-age-during-the-first-wave-of-the-pandemic_2019-2020_map_17838_eng.jpg|left|thumb|300px|Map: Registered unemployment by sex and age during the first wave of the pandemic. 2019-2020. Spain. [//centrodedescargas.cnig.es/CentroDescargas/busquedaRedirigida.do?ruta=PUBLICACION_CNIG_DATOS_VARIOS/aneTematico/Spain_Registered-unemployment-by-sex-and-age-during-the-first-wave-of-the-pandemic_2019-2020_map_17838_eng.pdf PDF]. [//centrodedescargas.cnig.es/CentroDescargas/busquedaRedirigida.do?ruta=PUBLICACION_CNIG_DATOS_VARIOS/aneTematico/Spain_Registered-unemployment-by-sex-and-age-during-the-first-wave-of-the-pandemic_2019-2020_map_17838_eng.zip Data]. Interactive versions [//interactivo-atlasnacional.ign.es/index.php#c=indicator&i=s17838_a.s17838_a&i2=c12249.c12249&t=A02&t2=A03&view=map10 1] [//interactivo-atlasnacional.ign.es/index.php#c=indicator&i=s17838_b.s17838_b&i2=c12249.c12249&t=A02&t2=A03&view=map10 2] .]] |
| − | + | Some of the workers who lost their jobs were classified as unemployed for statistical purposes (unemployed are considered those who do not have a job but are available to work and actively seeking employment). Others chose to leave the labour market and join the economically inactive population. The amount of people classified as unemployed depends on the requirements that shall be met to be considered as such. There are two statistical sources usually used to measure unemployment, i.e. ‘registered unemployment’ carried out by the National Public Employment Service, and ‘estimated unemployment according to the Labour Force Survey’, accomplished by the National Statistics Institute. These data are produced by two different institutions and have differing public purposes, i.e. the former aims at protecting jobs, whilst the latter is purely statistical. They provide different pieces of information and measure different concepts. Therefore, their figures differ. | |
| − | + | Unemployment registered by the National Public Employment Service is an administrative statistic obtained from the register of job seekers, which excludes anyone not meeting the requirements to be included in this register. These data may only provide a limited analysis of the general trends followed by employment as they may not be used to calculate the unemployment rate and are based on a subjective classification of unemployed. Nevertheless, a general overview on the impact of the health crisis on employment may be inferred from these data. | |
| − | + | Registered unemployed fell in Spain from over four and a half million at the beginning of 2015 to three million in the summer of 2019. This drop is compatible with a seasonal pattern that sees unemployment fall during the summer season due to increased demand for workers in tourism. After the 2019 summer season, there was a slight growth in the amount of registered unemployed, as expected. However, registered unemployment boomed from March 2020, once the state of alarm was enacted. The amount of unemployed registered in the offices of the public employment services grew by over 300,000 in just one month. The upward trend remained throughout April and May 2020 and then continued its rising trend over the summer, albeit with fluctuations. | |
| − | + | The distribution of registered unemployed by sex and age did not change during this period. Women were the majority in all regions, and only around 8% of registered unemployed were under 25 years of age. Many unemployed registered as job seekers in order to receive the unemployment benefit they were entitled to, which is linked to the time they were employed in their previous jobs and paying contributions to the Social Security system. As a result, many young people in this group may have not registered as job seekers as they had not worked enough time to earn the right to this benefit. | |
| − | |||
| − | + | [[File:Spain_Registered-unemployment-by-economic-sector_2018-2019_map_17843_eng.jpg|right|thumb|300px|Map: Registered unemployment by economic sector. 2018-2019. Spain. [//centrodedescargas.cnig.es/CentroDescargas/busquedaRedirigida.do?ruta=PUBLICACION_CNIG_DATOS_VARIOS/aneTematico/Spain_Registered-unemployment-by-economic-sector_2018-2019_map_17843_eng.pdf PDF]. [//centrodedescargas.cnig.es/CentroDescargas/busquedaRedirigida.do?ruta=PUBLICACION_CNIG_DATOS_VARIOS/aneTematico/Spain_Registered-unemployment-by-economic-sector_2018-2019_map_17843_eng.zip Data]. [//interactivo-atlasnacional.ign.es/index.php#c=indicator&i=s17843.s17843&i2=c12305.c12305&t=A02&t2=A02&view=map9 Interactive version]]] | |
| + | [[File:Spain_Registered-unemployment-by-economic-sector-during-the-first-wave-of-the-pandemic_2019-2020_map_17844_eng.jpg|right|thumb|300px|Map: Registered unemployment by economic sector during the first wave of the pandemic. 2019-2020. Spain. [//centrodedescargas.cnig.es/CentroDescargas/busquedaRedirigida.do?ruta=PUBLICACION_CNIG_DATOS_VARIOS/aneTematico/Spain_Registered-unemployment-by-economic-sector-during-the-first-wave-of-the-pandemic_2019-2020_map_17844_eng.pdf PDF]. [//centrodedescargas.cnig.es/CentroDescargas/busquedaRedirigida.do?ruta=PUBLICACION_CNIG_DATOS_VARIOS/aneTematico/Spain_Registered-unemployment-by-economic-sector-during-the-first-wave-of-the-pandemic_2019-2020_map_17844_eng.zip Data]. [//interactivo-atlasnacional.ign.es/index.php#c=indicator&i=s17844.s17844&i2=c12326.c12326&t=A02&t2=A02&view=map9 Interactive version].]] Registered unemployment dropped in all regions in the period from March to June both in 2018 and 2019. The drop was less severe in Catalonia (Catalunya/Cataluña), the Region of Valencia (Comunitat Valenciana), the Region of Murcia (Región de Murcia), Andalusia (Andalucía), the Balearic Islands (Illes Balears) and the Canary Islands (Canarias). As this period comes before the summer high season for tourism, recruitment levels are positive, yet never as intense as those registered during the summer. However, the effects of the pandemic become evident when comparing these months in 2019 and 2020. Data for 2020 show a general rise in unemployment throughout Spain. The situation in the Balearic Islands (Illes Balears), where the fall in employment led to a 63% increase in registered unemployed, is particularly challenging. The closure of borders to international tourists and the state of alarm that limited mobility for domestic tourists led to a standstill of tourism, which plays a crucial role in economy in the Balearic Islands (Illes Balears). | ||
| + | |||
| + | Provincial differences in the variation in registered unemployed and in the incidence of unemployment, shown on the map on [[:File:Spain_Registered-unemployment-by-economic-sector-during-the-first-wave-of-the-pandemic_2019-2020_map_17844_eng.jpg|| ''Registered unemployment by economic sector during the first wave of the pandemic'']], may be attributed to two types of factors. Firstly, pandemic-related factors, in terms of restrictions on mobility and the incidence of the disease. Secondly, the production-related factors that define the economy of each province. | ||
| + | |||
| + | According to data from the Ministry of Work and Social Economy, the bulk of the monthly increase in unemployment by sector was concentrated in the service sector in absolute terms, which saw a rise of 206,000 in March 2020, 9% more than in the previous month. In relative terms, however, the rise was more significant in the industry sector (25,194 people and 9.15%) and, above all, in the construction sector (58,000 people and 22.9%). Finally, the group of people without previous employment recorded 4,984 new job seekers, increasing by 1.91%. From April to May 2020, registered unemployment decreased in the construction sector (23,717 people, -6.89%) and in the industry (262 fewer unemployed people, -0.08%). By contrast, registered unemployment rose, above all, in the service sector (40,784 more job seekers, 1.50%), in the agricultural sector (710 job seekers, 0.43%) and in the group without previous employment (9,058 people, 3.30%). | ||
| + | |||
| + | Food and beverage services was the economic sector hardest hit by the pandemic as public health measures focused on reducing the capacity of premises, such as bars and restaurants. Tourism was also severely affected by restrictions on mobility, including regional perimeter closures and flight bans. All provinces registered a rise in unemployment in the service sector, yet this rise was even more pronounced in those provinces where tourism and food and beverage services play a more relevant role, such as the Balearic Islands (Illes Balears), Málaga, Girona and Tarragona, where international tourism is critical. Those provinces that registered lower rises in unemployment in the service sector were Ourense, León, Salamanca, Zamora, Toledo, Ciudad Real, Cuenca, Albacete and Murcia. | ||
| + | |||
| + | Economic activities related to tourism, which had been following a positive trend in previous years, were particularly disadvantaged during the first wave of the pandemic. According to data from the Tourist Movement on Borders Survey, accomplished by the National Statistics Institute, 20.6 million non-residents entered Spain in March, April and May 2019. The figure for the same period in 2020 was just 2 million (although Spanish borders were closed on 14 March 2020). The sharp drop in foreign tourists and the limitations to domestic tourism led to numerous passenger transport routes being cancelled as well as accommodation reservations being revoked. | ||
| + | |||
| + | Other areas of economic activity within the service sector were also particularly hit, registering sharp rises in unemployment that will likely prove difficult to reverse after the return to ‘new normal life’. The | ||
| + | non-food retail sector, which was forced to close during the state of alarm, is one such example. The shutdown and decrease in families’ disposable income caused by the rise in unemployment utterly reduced revenues, leading to the closure of businesses and further job losses. | ||
| − | |||
| − | |||
| − | |||
| − | |||
| − | |||
{{ANESubirArriba}} | {{ANESubirArriba}} | ||
| − | {{ANETextoEpigrafe|epigrafe= | + | {{ANETextoEpigrafe|epigrafe=Estimated unemployment according to the Labour Force Survey}} |
| − | + | Unemployment rate is estimated in Spain by the National Statistics Institute through the Labour Force Survey, which is a large household sample survey, conducted in all EU Member States, providing quarterly results on labour participation of people aged 16 and over. Unemployment rate grew in Spain from 14% of the active population in the second quarter of 2019 to 15.3% in the second quarter of 2020 and continued to increase up to 16.26% in the third quarter of 2020. This survey has traditionally been regarded as the most accurate measurement of unemployment in Spain. However, given the extraordinary situation in spring 2020, it is hard for this survey to show in a single picture what happened in the labour market during this period. | |
<div><ul style="text-align: left; float:left; margin-left:0px; margin-right:0px"> | <div><ul style="text-align: left; float:left; margin-left:0px; margin-right:0px"> | ||
<li style="display: inline-block; vertical-align:top"> | <li style="display: inline-block; vertical-align:top"> | ||
| − | [[File: | + | [[File:Spain_Estimated-unemployment-by-sex_2019_map_17845_eng.jpg|left|thumb|300px|Map: Estimated unemployment by sex. 2019. Spain. [//centrodedescargas.cnig.es/CentroDescargas/busquedaRedirigida.do?ruta=PUBLICACION_CNIG_DATOS_VARIOS/aneTematico/Spain_Estimated-unemployment-by-sex_2019_map_17845_eng.pdf PDF]. [//centrodedescargas.cnig.es/CentroDescargas/busquedaRedirigida.do?ruta=PUBLICACION_CNIG_DATOS_VARIOS/aneTematico/Spain_Estimated-unemployment-by-sex_2019_map_17845_eng.zip Data]. [//interactivo-atlasnacional.ign.es/index.php#c=indicator&i=s17845.s17845&i2=c12267.c12267&t=A02&t2=A02&view=map10 Interactive version].]] |
</li> | </li> | ||
<li style="display: inline-block; vertical-align: top"> | <li style="display: inline-block; vertical-align: top"> | ||
| − | [[File: | + | [[File:Spain_Estimated-unemployment-by-sex-during-the-fisrt-wave-of-the-pandemic_2020_map_17846_eng.jpg|left|thumb|300px|Map: Estimated unemployment by sex during the fisrt wave of the pandemic. 2020. Spain. [//centrodedescargas.cnig.es/CentroDescargas/busquedaRedirigida.do?ruta=PUBLICACION_CNIG_DATOS_VARIOS/aneTematico/Spain_Estimated-unemployment-by-sex-during-the-fisrt-wave-of-the-pandemic_2020_map_17846_eng.pdf PDF]. [//centrodedescargas.cnig.es/CentroDescargas/busquedaRedirigida.do?ruta=PUBLICACION_CNIG_DATOS_VARIOS/aneTematico/Spain_Estimated-unemployment-by-sex-during-the-fisrt-wave-of-the-pandemic_2020_map_17846_eng.zip Data]. [//interactivo-atlasnacional.ign.es/index.php#c=indicator&i=s17846.s17846&i2=c12271.c12271&t=A03&t2=A02&view=map10 Interactive version].]] |
</li> | </li> | ||
| − | </ul></div> | + | </ul></div>For example, furloughed workers were not classified as unemployed –even though they were not working– as they continued to be linked to their company and received payments from the government to a large proportion of their salaries. Another example of the challenges involved in taking an accurate reading of these statistics is the situation affecting the over a million people who lost their jobs in the second quarter of the year. The vast majority of these could not be officially considered ‘unemployed’ as they could not actively seek employment during lockdown, which is a key requirement for the statistical definition of unemployment. Therefore, these workers were considered ‘inactive’, which meant that although the inactive population increased, conversely unemployed did not grow to the extent that may have been expected. |
| − | + | Considering the heterogeneity of the situations observed after the arrival of COVID-19, a broader understanding of the term ‘unemployed’ is required to account for people who are not working but statistically do not meet the requirements to be considered as ‘unemployed’. Therefore, in addition to the unemployed as defined by the criteria of the International Labour Organisation [ILO] (not in work but available and actively seeking employment), this group includes employed who had to stop doing their jobs for technical or economical reasons as well as furloughed workers. It also includes available inactive people, i.e. unemployed who cannot look for work and therefore do not meet the ILO criteria to be considered as such. Including these employed and inactive in the ‘extended unemployment figures’ enables calculating an extended unemployment rate, which draws a more accurate picture of the situation experienced by different groups in the labour market. This estimated rate grew in Spain from 16.4% towards the end of 2019 to 35.6% in the second quarter of 2020. The rate according to the ILO criteria for the same period went from 13.8% to 15.3%. | |
| − | |||
| − | |||
| − | |||
<div><ul style="text-align: left; float:right; margin-left:0px; margin-right:0px"> | <div><ul style="text-align: left; float:right; margin-left:0px; margin-right:0px"> | ||
| − | <li style="display: inline-block; vertical-align:top"> | + | <li style="display: inline-block; vertical-align:top"> |
| − | [[File: | + | [[File:Spain_Estimated-youth-unemployment_2019_map_17847_eng.jpg|right|thumb|300px|Map: Estimated youth unemployment. 2019. Spain. [//centrodedescargas.cnig.es/CentroDescargas/busquedaRedirigida.do?ruta=PUBLICACION_CNIG_DATOS_VARIOS/aneTematico/Spain_Estimated-youth-unemployment_2019_map_17847_eng.pdf PDF]. [//centrodedescargas.cnig.es/CentroDescargas/busquedaRedirigida.do?ruta=PUBLICACION_CNIG_DATOS_VARIOS/aneTematico/Spain_Estimated-youth-unemployment_2019_map_17847_eng.zip Data]. Interactive versions [//interactivo-atlasnacional.ign.es/index.php#c=indicator&i=s17847a.s17847a&i2=c12256.c12256&t=A02&t2=A02&view=map10 1] [//interactivo-atlasnacional.ign.es/index.php#c=indicator&i=s17847b.s17847b&i2=c12256.c12256&t=A02&t2=A02&view=map10 2]. ]] |
</li> | </li> | ||
<li style="display: inline-block; vertical-align: top"> | <li style="display: inline-block; vertical-align: top"> | ||
| − | [[File: | + | [[File:Spain_Estimated-youth-unemployment-during-the-first-wave-of-the-pandemic_2020_map_17848_eng.jpg|right|thumb|300px|Map: Estimated youth unemployment during the first wave of the pandemic. 2020. Spain. [//centrodedescargas.cnig.es/CentroDescargas/busquedaRedirigida.do?ruta=PUBLICACION_CNIG_DATOS_VARIOS/aneTematico/Spain_Estimated-youth-unemployment-during-the-first-wave-of-the-pandemic_2020_map_17848_eng.pdf PDF]. [//centrodedescargas.cnig.es/CentroDescargas/busquedaRedirigida.do?ruta=PUBLICACION_CNIG_DATOS_VARIOS/aneTematico/Spain_Estimated-youth-unemployment-during-the-first-wave-of-the-pandemic_2020_map_17848_eng.zip Data]. Interactive versions [//interactivo-atlasnacional.ign.es/index.php#c=indicator&i=s17848a.s17848a&i2=c12263.c12263&t=A02&t2=A02&view=map100 1] [//interactivo-atlasnacional.ign.es/index.php#c=indicator&i=s17848b.s17848b&i2=c12263.c12263&t=A02&t2=A02&view=map10 2].]] |
</li> | </li> | ||
</ul></div> | </ul></div> | ||
| − | + | From the point of view of society and the labour market, the ‘available inactive’ population, i.e. those officially considered inactive because they do not meet the requirements to be in the labour market but wish to join it, is a matter of major concern. Every day spent in this situation makes them more vulnerable and may result in them being permanently excluded from the labour market. | |
| − | + | ||
| + | The gender gap in the unemployment rate slightly decreased during the pandemic. In the second quarter of 2019, the unemployment rate for women was 3.3% higher than the one for men. By the second quarter of 2020, the gap had narrowed to 2.6%. However, this drop may not be interpreted as a relative improvement in female employment. Instead, as previously explained, it indicates that some unemployed were statistically classified as inactive, more of whom were women. The unemployment rate amongst the under 25s increased from 33% to 39.6%, showing a more significant relative increase than seen in the whole population. | ||
| + | |||
| + | The increase in the unemployment rate in the first quarter of 2020 was well widespread throughout Spain. The regions that had the highest unemployment rate in 2019, which were Andalusia (Andalucía), the Canary Islands (Canarias) and Castile–La Mancha (Castilla–La Mancha), continued to hold this position in 2020. The same evolution was observed in the unemployment rate amongst the under 25s. | ||
| + | |||
| + | |||
| − | |||
{{ANESubirArriba}} | {{ANESubirArriba}} | ||
| − | {{ANETextoEpigrafe|epigrafe= | + | {{ANETextoEpigrafe|epigrafe=Furlough Schemes}} |
| + | |||
| + | [[File:Spain_Furloughed-workers_2020_map_17849_eng.jpg|right|thumb|300px|Map: Furloughed workers. 2020. Spain. [//centrodedescargas.cnig.es/CentroDescargas/busquedaRedirigida.do?ruta=PUBLICACION_CNIG_DATOS_VARIOS/aneTematico/Spain_Furloughed-workers_2020_map_17849_eng.pdf PDF]. [//centrodedescargas.cnig.es/CentroDescargas/busquedaRedirigida.do?ruta=PUBLICACION_CNIG_DATOS_VARIOS/aneTematico/Spain_Furloughed-workers_2020_map_17849_eng.zip Data]. [//interactivo-atlasnacional.ign.es/index.php#c=indicator&i=s17849.s17849&t=A02&view=map9 Interactive version].]] | ||
| − | + | The labour market began to feel rapidly the impact of the pandemic short after 14 March 2020. The public administrations quickly took hefty measures to lessen the effects of lockdown for both companies and workers. One of the main priorities of Royal Decree Law 8/2020 of 17 March, on extraordinary urgent measures to reduce the economic and social impact of COVID-19, was to protect the productive and social fabric so that it could resume normal activity as soon as possible. One of the most important and effective mechanisms was Coronavirus Job Retention Scheme, officially called ‘Temporary Employment Regulation Scheme’, which is a furlough-type instrument which already existed in Spanish regulation but was adapted to fit the new scenario. This instrument allowed companies to temporarily suspend an employment contract or reduce its working hours whilst keeping the employment relationship. Whilst this Scheme was in force, workers received a payment from the government to compensate for the total or partial loss of their salary. Two new furlough schemes were set, i.e. one due to force majeure and the other due to objective reasons. Both were intended to prevent lay-offs linked to uncertainty and the drop in activity caused by lockdown. The intensity and duration of the health crisis forced the public administrations to lengthen this mechanism on several occasions, to the extent that it was still in force in June 2021. | |
<div><ul style="text-align: left; float:left; margin-left:0px; margin-right:0px"> | <div><ul style="text-align: left; float:left; margin-left:0px; margin-right:0px"> | ||
<li style="display: inline-block; vertical-align:top"> | <li style="display: inline-block; vertical-align:top"> | ||
| − | [[File: | + | [[File:Spain_Companies-using-furlough-schemes-according-to-economic-sector_2020_statisticalgraph_17876_eng.jpg|left|thumb|300px|Statistical graph: Companies using furlough schemes according to economic sector. 2020. Spain.]] |
</li> | </li> | ||
<li style="display: inline-block; vertical-align: top"> | <li style="display: inline-block; vertical-align: top"> | ||
| − | [[File: | + | [[File:Spain_Companies-using-furlough-schemes_2020_map_17874_eng.jpg|right|thumb|300px|Map: Companies using furlough schemes. 2020. Spain. [//centrodedescargas.cnig.es/CentroDescargas/busquedaRedirigida.do?ruta=PUBLICACION_CNIG_DATOS_VARIOS/aneTematico/Spain_Companies-using-furlough-schemes_2020_map_17874_eng.pdf PDF]. [//centrodedescargas.cnig.es/CentroDescargas/busquedaRedirigida.do?ruta=PUBLICACION_CNIG_DATOS_VARIOS/aneTematico/Spain_Companies-using-furlough-schemes_2020_map_17874_eng.zip Data]. [//interactivo-atlasnacional.ign.es/index.php#c=indicator&i=s17874.s17874&t=A02&view=map9 Interactive version].]] |
</li> | </li> | ||
| − | </ul></div> | + | </ul></div>Data registered by the National Public Employment Service for the months of May and June 2020 show that Furlough Schemes were predominantly used in the service sector, particularly in commerce and the food and beverage services. To a lesser extent, Furlough Schemes were also used in professional and administrative services, education, sports, culture, social services, manufacturing and construction. Restrictions and limitations being loosened and then lifted after lockdown and the gradual return to ‘new normal life’ from May 2020, led in all cases to a drop in uptakes by June 2020. |
| − | + | ||
| + | Data on companies using Furlough Schemes, as well as on employees who received unemployment benefits as a result of being affected by this mechanism, show that the vast majority were due to force majeure and job suspension in the second quarter of 2020, with far fewer being used for objective reasons or to allow partial unemployment. The maps show that Furlough Schemes were more commonly used in areas of Spain where the local economy is largely based on the service sector, in general, and the food and beverage services, in particular. | ||
| − | |||
| − | |||
{{ANESubirArriba}} | {{ANESubirArriba}} | ||
| − | {{ANETextoEpigrafe|epigrafe= | + | {{ANETextoEpigrafe|epigrafe=Unemployment, poverty and social protection}} |
| − | [[File: | + | [[File:Spain_Beneficiaries-of-unemployment-benefits_2019-2020_map_17873_eng.jpg|left|thumb|300px|Map: Beneficiaries of unemployment benefits. 2019-2020. Spain. [//centrodedescargas.cnig.es/CentroDescargas/busquedaRedirigida.do?ruta=PUBLICACION_CNIG_DATOS_VARIOS/aneTematico/Spain_Beneficiaries-of-unemployment-benefits_2019-2020_map_17873_eng.pdf PDF]. [//centrodedescargas.cnig.es/CentroDescargas/busquedaRedirigida.do?ruta=PUBLICACION_CNIG_DATOS_VARIOS/aneTematico/Spain_Beneficiaries-of-unemployment-benefits_2019-2020_map_17873_eng.zip Data]. Interactive versions [//interactivo-atlasnacional.ign.es/index.php#c=indicator&i=s17873a.s17873a&t=A02&view=map10 1] [//interactivo-atlasnacional.ign.es/index.php#c=indicator&i=s17873b.s17873b&t=A02&view=map10 2].]] |
| − | [[File: | + | [[File:Spain_Households-with-no-income_2019-2020_map_17855_eng.jpg|right|thumb|300px|Map: Households with no income. 2019-2020. Spain. [//centrodedescargas.cnig.es/CentroDescargas/busquedaRedirigida.do?ruta=PUBLICACION_CNIG_DATOS_VARIOS/aneTematico/Spain_Households-with-no-income_2019-2020_map_17855_eng.pdf PDF]. [//centrodedescargas.cnig.es/CentroDescargas/busquedaRedirigida.do?ruta=PUBLICACION_CNIG_DATOS_VARIOS/aneTematico/Spain_Households-with-no-income_2019-2020_map_17855_eng.zip Data]. Interactive versions [//interactivo-atlasnacional.ign.es/index.php#c=indicator&i=c12273.c12273&t=A02&view=map10 1] [//interactivo-atlasnacional.ign.es/index.php#c=indicator&i=c12274.c12274&t=A02&view=map10 2].]] |
| − | [[File: | + | [[File:Spain_Evolution-in-the-amount-of-households-with-no-income_2005-2020_statisticalgraph_17864_eng.jpg|right|thumb|300px|Statistical graph: Evolution in the amount of households with no income. 2005-2020. Spain.]] |
| − | [[File: | + | [[File:Spain_Households-where-all-active-members-are-unemployed_2020_map_18363_eng.jpg|left|thumb|300px|Map: Households where all active members are unemployed. 2020. Spain. [//centrodedescargas.cnig.es/CentroDescargas/busquedaRedirigida.do?ruta=PUBLICACION_CNIG_DATOS_VARIOS/aneTematico/Spain_Households-where-all-active-members-are-unemployed_2020_map_18363_eng.pdf PDF]. [//centrodedescargas.cnig.es/CentroDescargas/busquedaRedirigida.do?ruta=PUBLICACION_CNIG_DATOS_VARIOS/aneTematico/Spain_Households-where-all-active-members-are-unemployed_2020_map_18363_eng.zip Data]. [//interactivo-atlasnacional.ign.es/index.php#c=indicator&i=c12855.c12855&t=A02&view=map10 Interactive version].]] |
| − | [[File: | + | [[File:Spain_Evolution-in-the-amount-of-households-where-all-active-members-are-unemployed_2005-2020_statisticalgraph_18364_eng.jpg|right|thumb|300px|Statistical graph: Evolution in the amount of households where all active members are unemployed. 2005-2020. Spain.]] |
| + | The first estimates of the impact of the pandemic on economy in Europe confirm that poverty rate is increasing in many states. In spite of the emergency measures put in force by the governments, the current situation is breeding a rise in income disparities between states and reducing the social and territorial cohesion of the continent. States in the south, and Spain in particular, have fewer jobs that may be carried out using home office, yet those who may work from home tend to be more qualified and have higher salaries than in other central European states. In addition, fewer medium and low-skilled jobs were deemed as being ‘essential’ in southern European states, suggesting that the impact of the pandemic on lower-income households was more significant than in other states. | ||
| − | + | Comparing the months of May 2019 and May 2020 reveals a remarkable rise in the amount of people claiming unemployment benefits throughout Spain, especially by those affected by furloughs (see the map on [[:File:Spain_Beneficiaries-of-unemployment-benefits_2019-2020_map_17873_eng.jpg|''Beneficiaries of unemployment benefits'']]). However, significant differences may be observed in the regional coverage rates (see the map on [[:File:Spain_Coverage-of-unemployment-benefits_2019-2020_map_17871_eng.jpg|''Coverage of unemployment benefits'']]), which measure the ratio of beneficiaries of unemployment benefits to unemployed. The coverage of unemployment benefits increased in the northern and eastern regions, whilst it reduced in some southern regions, especially Extremadura and Andalusia (Andalucía). | |
| − | [[ | ||
| − | |||
| − | + | [[File:Spain_Coverage-of-unemployment-benefits_2019-2020_map_17871_eng.jpg|left|thumb|300px|Map: Coverage of unemployment benefits. 2019-2020. Spain. [//centrodedescargas.cnig.es/CentroDescargas/busquedaRedirigida.do?ruta=PUBLICACION_CNIG_DATOS_VARIOS/aneTematico/Spain_Coverage-of-unemployment-benefits_2019-2020_map_17871_eng.pdf PDF]. [//centrodedescargas.cnig.es/CentroDescargas/busquedaRedirigida.do?ruta=PUBLICACION_CNIG_DATOS_VARIOS/aneTematico/Spain_Coverage-of-unemployment-benefits_2019-2020_map_17871_eng.zip Data]. Interactive versions [//interactivo-atlasnacional.ign.es/index.php#c=indicator&i=c12336.c12336&t=A02&view=map10 1] [//interactivo-atlasnacional.ign.es/index.php#c=indicator&i=c12337.c12337&t=A02&view=map10 2] [http://interactivo-atlasnacional.ign.es/index.php#c=indicator&i=c12338.c12338&t=A02&view=map10 3] .]] | |
| + | The effects of the pandemic revealed more quickly and were more harmful for more vulnerable households, according to the quarterly data from the Labour Force Survey. Both the graph on the [[:File:Evolution in the amount of households.jpg|''Evolution in the amount of households'']] where all active members are unemployed and the graph on the [[:File:Spain_Evolution-in-the-amount-of-households-with-no-income_2005-2020_statisticalgraph_17864_eng.jpg|''Evolution in the amount of households with no income'']] show that the second quarter of 2020 marked a clear change in trend with respect to the one observed since 2014. | ||
| − | + | This change in direction entails an increased risk of unemployment, which is much greater for those who live in vulnerable households. The poorest households saw their income drop by a third in the initial months of the pandemic, especially if their members came from ‘informal employment’. This caused a rapid rise in the amount of households living in severe poverty, especially amongst those with dependent minors. The percentage of households with no income, whether due to lack of work or to not having received benefits, increased by almost 20% from the last quarter of 2019 to the second quarter of 2020. However, it shall be pointed out that this rise was nearly double as much for households with dependent minors (37%). Therefore, the economic impact of lockdown seems to have been significantly more severe in households with dependent minors, the long-term consequences of which are an issue of major concern. | |
| + | |||
| + | The ‘Regional Minimum Incomes’ granted by the regional public administrations were until June 2020 the only public policies designed to cover the risk of extreme poverty. For several decades, the geographical coverage of this benefit has been very heterogeneous. In average, these benefits reached 17% of households at risk of poverty throughout Spain in 2019. However, whilst in some regions, such as the Basque Country (Euskadi/País Vasco) and Navarre (Navarra), all households with income below the poverty line were covered, in others, such as Castile–La Mancha (Castilla–La Mancha) and Andalusia (Andalucía), this benefit reached under 10% of them. In addition to this regional inequality, the Spanish minimum income model suffered from a low protective capacity and minimal coverage. With the onset of the COVID-19 health crisis, new measures were put in place to protect households living in extreme poverty. Indirect support mechanisms were developed and the regulations were revised to prevent the withdrawal of basic utilities due to non-payment (electricity, gas, water and telecommunications). Electricity rate subsidies were extended to a wider range of social groups, and automatic moratoria on mortgage payments and various aids to vulnerable tenants were introduced. The main problem was the delay in granting them, which probably made them less effective. It is important to point out that these were emergency and needed transitory measures not intended to solve long-term structural problems. | ||
| + | |||
| + | A more substantial direct support scheme, the national Minimum Subsistence Income, was introduced during the pandemic as a permanent social protection instrument designed to reduce the high amount of households at risk of poverty. This scheme is intended to ensure that any household with an income below a minimum threshold (determined by its number of dependent adults and minors) may have its income supplemented with a benefit that allows to reach said threshold. | ||
| + | |||
| + | However, granting this benefit to the population for which it is intended is proving to be a slow and challenging process, making it difficult to assess the effectiveness of this policy. The initial results indicate that several Andalusian provinces concentrate the highest amount of national Minimum Subsistence Income beneficiaries, i.e. Cádiz, Seville (Sevilla), Granada, Almería and Jaén. However, analysing the percentage of households receiving benefits with an income below 40% of the median (i.e. those at risk of severe poverty), draws a very different picture. For example, in Castile and León (Castilla y León) and Navarre (Navarra), over 20% of potential beneficiaries received the benefit, whilst this figure was only 7% for Catalonia (Catalunya/Cataluña). | ||
| − | |||
<div><ul style="text-align: center"> | <div><ul style="text-align: center"> | ||
<li style="display: inline-block; vertical-align:top"> | <li style="display: inline-block; vertical-align:top"> | ||
| − | [[File: | + | [[File:Spain_Households-receiving-Regional-Minimum-Income-benefits_2019_map_18209_eng.jpg|left|thumb|300px|Map: Households receiving Regional Minimum Income benefits. 2019. Spain. [//centrodedescargas.cnig.es/CentroDescargas/busquedaRedirigida.do?ruta=PUBLICACION_CNIG_DATOS_VARIOS/aneTematico/Spain_Households-receiving-Regional-Minimum-Income-benefits_2019_map_18209_eng.pdf PDF]. [//centrodedescargas.cnig.es/CentroDescargas/busquedaRedirigida.do?ruta=PUBLICACION_CNIG_DATOS_VARIOS/aneTematico/Spain_Households-receiving-Regional-Minimum-Income-benefits_2019_map_18209_eng.zip Data]. [//interactivo-atlasnacional.ign.es/index.php#c=indicator&i=c12821.c12821&t=A02&view=map10 Interactive version].]] |
</li> | </li> | ||
<li style="display: inline-block; vertical-align:top"> | <li style="display: inline-block; vertical-align:top"> | ||
| − | [[File: | + | [[File:Spain_Households-in-poverty-receiving-regional-minimum-income-benefits_2019_map_18210_eng.jpg|left|thumb|300px|Map: Households in poverty receiving regional minimum income benefits. 2019. Spain. [//centrodedescargas.cnig.es/CentroDescargas/busquedaRedirigida.do?ruta=PUBLICACION_CNIG_DATOS_VARIOS/aneTematico/Spain_Households-in-poverty-receiving-regional-minimum-income-benefits_2019_map_18210_eng.pdf PDF]. [//centrodedescargas.cnig.es/CentroDescargas/busquedaRedirigida.do?ruta=PUBLICACION_CNIG_DATOS_VARIOS/aneTematico/Spain_Households-in-poverty-receiving-regional-minimum-income-benefits_2019_map_18210_eng.zip Data]. [//interactivo-atlasnacional.ign.es/index.php#c=indicator&i=c12822.c12822&t=A02&view=map10 Interactive version].]] |
</li> | </li> | ||
<li style="display: inline-block; vertical-align:top"> | <li style="display: inline-block; vertical-align:top"> | ||
| − | [[File: | + | [[File:Spain_Benefits-from-the-National-Minimum-Subsistence-Income-by-household_2020_map_18207_eng.jpg|left|thumb|300px|Map: Benefits from the National Minimum Subsistence Income by household. 2020. Spain. [//centrodedescargas.cnig.es/CentroDescargas/busquedaRedirigida.do?ruta=PUBLICACION_CNIG_DATOS_VARIOS/aneTematico/Spain_Benefits-from-the-National-Minimum-Subsistence-Income-by-household_2020_map_18207_eng.pdf PDF]. [//centrodedescargas.cnig.es/CentroDescargas/busquedaRedirigida.do?ruta=PUBLICACION_CNIG_DATOS_VARIOS/aneTematico/Spain_Benefits-from-the-National-Minimum-Subsistence-Income-by-household_2020_map_18207_eng.zip Data]. [//interactivo-atlasnacional.ign.es/index.php#c=indicator&i=c12649.c12649&t=A02&view=map9 Interactive version].]] |
</li> | </li> | ||
<li style="display: inline-block; vertical-align:top"> | <li style="display: inline-block; vertical-align:top"> | ||
| − | [[File: | + | [[File:Spain_Benefits-from-the-National-Minimum-Subsistence-Income-by-household-in-poverty_2020_map_18208_eng.jpg|left|thumb|300px|Map: Benefits from the National Minimum Subsistence Income by household in poverty. 2020. Spain. [//centrodedescargas.cnig.es/CentroDescargas/busquedaRedirigida.do?ruta=PUBLICACION_CNIG_DATOS_VARIOS/aneTematico/Spain_Benefits-from-the-National-Minimum-Subsistence-Income-by-household-in-poverty_2020_map_18208_eng.pdf PDF]. [//centrodedescargas.cnig.es/CentroDescargas/busquedaRedirigida.do?ruta=PUBLICACION_CNIG_DATOS_VARIOS/aneTematico/Spain_Benefits-from-the-National-Minimum-Subsistence-Income-by-household-in-poverty_2020_map_18208_eng.zip Data]. [//interactivo-atlasnacional.ign.es/index.php#c=indicator&i=c12686.c12686&t=A02&view=map10 Interactive version].]] |
</li> | </li> | ||
</ul></div> | </ul></div> | ||
| − | {{ANEAutoria|Autores= Ana Arriba González de Durana, Olga Cantó Sánchez, Inmaculada Cebrián López | + | |
| + | {{ANEAutoria|Autores= Ana Arriba González de Durana, Olga Cantó Sánchez, Inmaculada Cebrián López and Gloria Moreno Raymundo}} | ||
{{ANESubirArriba}} | {{ANESubirArriba}} | ||
Latest revision as of 12:45, 2 June 2022
The COVID-19 pandemic in Spain. First wave: from the first cases to the end of June 2020
Monographs from the National Atlas of Spain. New content
Thematic structure > Social, economic and environmental effects > Labour market

Assessing the labour market becomes crucial when rating an economy, its dynamism, the social welfare and the income level of the population. The labour market is made up of people, some of whom offer their labour in exchange for a salary that enables them to live, and some of whom demand this labour to produce the goods they sell and are willing to pay these salaries in return.
The Spanish labour market has some unique characteristics that make it highly vulnerable to any negative impact, such as the COVID-19 pandemic. The relationship between supply and demand for labour suffered a major downturn in Spain in March 2020 that had a heavy impact on the behaviour of the main indicators on the labour market and utterly modified the trends seen before the setback.
The amount of workers affiliated to the Social Security system is an indicator on the capacity of the labour market to grow or reduce formal employment. The amount of affiliated workers followed the usual patterns throughout 2019, as may observed on the graph on the Evolution in the amount of workers affiliated to the Social Security system, i.e. starting from a low level in January and then steadily rising in the months leading up to the summer period, after which it remained virtually stagnant, except for slight reductions towards the end of August and December. This pattern is indicative of the seasonality of the Spanish economy and is more evident in the General Scheme of the Social Security system than in the Special Scheme for Self-Employed Workers.
-
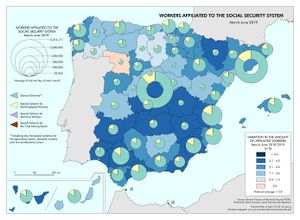 Map: Workers affiliated to the Social Security System. 2018-2019. Spain. PDF. Data. Interactive version.
 -
 Map: Workers affiliated to the Social Security system during the first wave of the pandemic. 2019-2020. Spain. PDF. Data. Interactive version.


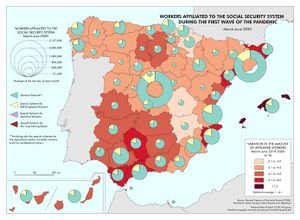
This pattern continued towards the beginning of 2020, but was suddenly interrupted by the state of alarm on 14 March, which brought all ‘non-essential economic activities’ to a halt. This had a major impact on the amount of workers affiliated to the Social Security system. From 14 to 31 March, affiliations plummeted. The Social Security system lost 898,822 affiliated workers in just one month, of which 855,081 were affiliated to the General Scheme (equivalent to a drop of 5.63%) and 40,877 to the Special Scheme for Self-Employed Workers (equivalent to a reduction of 1.25%).
The measures introduced by the national government to lessen the impact of lockdown went some way to lightening the drop in affiliation, yet succeeded unevenly from one province to another. The maps on affiliated workers for the period from March to June 2019 and 2020 show that the coastal provinces that rely heavily on tourism, such as Cádiz, Málaga, Alicante, Tarragona and Girona, lost between 6% and 8% of the affiliated workers, being the drop in the Balearic Islands (Illes Balears) even worse, at 11%. On the other hand, Biscay (Bizkaia), Gipuzkoa, Navarre (Navarra), Cuenca and Albacete were the least affected provinces, with falls that ranged from 0.1% to 2%. The rest of provinces saw reductions close to the national average, these being slightly higher in the south and scarcely lower in the north.
The impact also differed between sectors, with the most significant falls recorded in the construction sector (-17.08%), food and beverage services (-14.27%), administrative activities and auxiliary services (-8.91%), education (-5.24%) and transport and storage (-4.76%). The healthcare sector grew, in contrast, by 7,085 affiliated workers.
|
EMPLOYMENT CONTRACTS
 The drop in the amount of workers affiliated to the Social Security system who had temporary contracts (-17.30%) was much sharper than amongst those with permanent contracts (-1.92%). However, new contracts were signed in all regions, most of them temporary, as shown on the map on Employment Contracts during the pandemic. This map depicts the amount of employment contracts -both temporary and permanent- registered in the National Public Employment Service throughout the first wave of the pandemic. The variation in the amount of new contracts signed in 2020 in relation to those signed in the same period in 2019 is shown on the choropleth. The downturn in the labour market explains why this variation was negative in all regions, although not to the same degree. New contracts fell the most in the Balearic Islands (Illes Balears) (-72.3%), followed by the Canary Islands (Canarias) and some regions in northern Spain, with a negative variation ranging from -50% to -60%. Andalusia (Andalucía), the Region of Valencia (Comunitat Valenciana), Aragón, Navarre (Navarra) and La Rioja registered slightly lower decreases, of -40% to -50%. Falls registered in Extremadura and Castile-La Mancha (Castilla-La Mancha) were around -30% to -40%. Only in the Region of Murcia (Región de Murcia) was the fall somewhat lower (-28.5%). |
|
HOME OFFICE
Many companies and public administrations could only continue their activity during lockdown in spring 2020 by allowing their employees to work from home. A previously scarcely used labour format became almost overnight a large-scale experiment to test the possibilities offered by this way of managing the production process. According to the Labour Force Survey, at least 20% of employees in Spain were in home office during this period.
Figures highlight significant differences by region and sex. From a spatial point of view, the Region of Madrid (Comunidad de Madrid) stands out, as over 30% of employees were in home office. This contrasts with the Canary Islands (Canarias), La Rioja, Navarre (Navarra) and the Region of Murcia (Región de Murcia) where only under 15% of employees worked from home. In terms of gender, more women than men were in home office in most of the regions, especially in Aragón, Extremadura and the town of Melilla.
Some studies suggest that this widespread implementation of home office is linked to tasks that have a certain degree of autonomy. They also indicate that it is more prevalent amongst qualified people and in large companies.
|

Registered unemployment

One of the immediate effects of the health crisis on the labour market was that many people were unable to carry out the tasks they usually performed. Countless people saw their economic activity suspended by the economic shutdown following the state of alarm on 14 March, with exceptions only being made for activities that were considered ‘essential’. As restrictions were gradually loosened in May and June, some workers were able to return to work, yet many others were not. This second group included those whose companies made use of the exceptional measures put in place by the national government through the Coronavirus Job Retention Scheme (agreed upon by employers and unions and approved in Parliament), which allowed employers to reduce working hours and even suspend contracts. Also in this group were those unable to return to work, either because the company could not withstand the temporary shutdown and folded or because the company adjusted its workforce once economy opened again, what made some employees redundant.


Some of the workers who lost their jobs were classified as unemployed for statistical purposes (unemployed are considered those who do not have a job but are available to work and actively seeking employment). Others chose to leave the labour market and join the economically inactive population. The amount of people classified as unemployed depends on the requirements that shall be met to be considered as such. There are two statistical sources usually used to measure unemployment, i.e. ‘registered unemployment’ carried out by the National Public Employment Service, and ‘estimated unemployment according to the Labour Force Survey’, accomplished by the National Statistics Institute. These data are produced by two different institutions and have differing public purposes, i.e. the former aims at protecting jobs, whilst the latter is purely statistical. They provide different pieces of information and measure different concepts. Therefore, their figures differ.
Unemployment registered by the National Public Employment Service is an administrative statistic obtained from the register of job seekers, which excludes anyone not meeting the requirements to be included in this register. These data may only provide a limited analysis of the general trends followed by employment as they may not be used to calculate the unemployment rate and are based on a subjective classification of unemployed. Nevertheless, a general overview on the impact of the health crisis on employment may be inferred from these data.
Registered unemployed fell in Spain from over four and a half million at the beginning of 2015 to three million in the summer of 2019. This drop is compatible with a seasonal pattern that sees unemployment fall during the summer season due to increased demand for workers in tourism. After the 2019 summer season, there was a slight growth in the amount of registered unemployed, as expected. However, registered unemployment boomed from March 2020, once the state of alarm was enacted. The amount of unemployed registered in the offices of the public employment services grew by over 300,000 in just one month. The upward trend remained throughout April and May 2020 and then continued its rising trend over the summer, albeit with fluctuations.
The distribution of registered unemployed by sex and age did not change during this period. Women were the majority in all regions, and only around 8% of registered unemployed were under 25 years of age. Many unemployed registered as job seekers in order to receive the unemployment benefit they were entitled to, which is linked to the time they were employed in their previous jobs and paying contributions to the Social Security system. As a result, many young people in this group may have not registered as job seekers as they had not worked enough time to earn the right to this benefit.


Registered unemployment dropped in all regions in the period from March to June both in 2018 and 2019. The drop was less severe in Catalonia (Catalunya/Cataluña), the Region of Valencia (Comunitat Valenciana), the Region of Murcia (Región de Murcia), Andalusia (Andalucía), the Balearic Islands (Illes Balears) and the Canary Islands (Canarias). As this period comes before the summer high season for tourism, recruitment levels are positive, yet never as intense as those registered during the summer. However, the effects of the pandemic become evident when comparing these months in 2019 and 2020. Data for 2020 show a general rise in unemployment throughout Spain. The situation in the Balearic Islands (Illes Balears), where the fall in employment led to a 63% increase in registered unemployed, is particularly challenging. The closure of borders to international tourists and the state of alarm that limited mobility for domestic tourists led to a standstill of tourism, which plays a crucial role in economy in the Balearic Islands (Illes Balears).
Provincial differences in the variation in registered unemployed and in the incidence of unemployment, shown on the map on | Registered unemployment by economic sector during the first wave of the pandemic, may be attributed to two types of factors. Firstly, pandemic-related factors, in terms of restrictions on mobility and the incidence of the disease. Secondly, the production-related factors that define the economy of each province.
According to data from the Ministry of Work and Social Economy, the bulk of the monthly increase in unemployment by sector was concentrated in the service sector in absolute terms, which saw a rise of 206,000 in March 2020, 9% more than in the previous month. In relative terms, however, the rise was more significant in the industry sector (25,194 people and 9.15%) and, above all, in the construction sector (58,000 people and 22.9%). Finally, the group of people without previous employment recorded 4,984 new job seekers, increasing by 1.91%. From April to May 2020, registered unemployment decreased in the construction sector (23,717 people, -6.89%) and in the industry (262 fewer unemployed people, -0.08%). By contrast, registered unemployment rose, above all, in the service sector (40,784 more job seekers, 1.50%), in the agricultural sector (710 job seekers, 0.43%) and in the group without previous employment (9,058 people, 3.30%).
Food and beverage services was the economic sector hardest hit by the pandemic as public health measures focused on reducing the capacity of premises, such as bars and restaurants. Tourism was also severely affected by restrictions on mobility, including regional perimeter closures and flight bans. All provinces registered a rise in unemployment in the service sector, yet this rise was even more pronounced in those provinces where tourism and food and beverage services play a more relevant role, such as the Balearic Islands (Illes Balears), Málaga, Girona and Tarragona, where international tourism is critical. Those provinces that registered lower rises in unemployment in the service sector were Ourense, León, Salamanca, Zamora, Toledo, Ciudad Real, Cuenca, Albacete and Murcia.
Economic activities related to tourism, which had been following a positive trend in previous years, were particularly disadvantaged during the first wave of the pandemic. According to data from the Tourist Movement on Borders Survey, accomplished by the National Statistics Institute, 20.6 million non-residents entered Spain in March, April and May 2019. The figure for the same period in 2020 was just 2 million (although Spanish borders were closed on 14 March 2020). The sharp drop in foreign tourists and the limitations to domestic tourism led to numerous passenger transport routes being cancelled as well as accommodation reservations being revoked.
Other areas of economic activity within the service sector were also particularly hit, registering sharp rises in unemployment that will likely prove difficult to reverse after the return to ‘new normal life’. The non-food retail sector, which was forced to close during the state of alarm, is one such example. The shutdown and decrease in families’ disposable income caused by the rise in unemployment utterly reduced revenues, leading to the closure of businesses and further job losses.
Estimated unemployment according to the Labour Force Survey
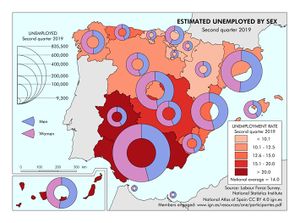
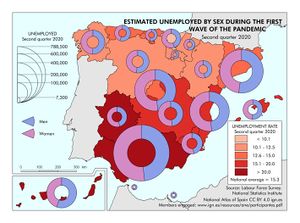
Unemployment rate is estimated in Spain by the National Statistics Institute through the Labour Force Survey, which is a large household sample survey, conducted in all EU Member States, providing quarterly results on labour participation of people aged 16 and over. Unemployment rate grew in Spain from 14% of the active population in the second quarter of 2019 to 15.3% in the second quarter of 2020 and continued to increase up to 16.26% in the third quarter of 2020. This survey has traditionally been regarded as the most accurate measurement of unemployment in Spain. However, given the extraordinary situation in spring 2020, it is hard for this survey to show in a single picture what happened in the labour market during this period.
-
-
 Map: Estimated unemployment by sex during the fisrt wave of the pandemic. 2020. Spain. PDF. Data. Interactive version.


For example, furloughed workers were not classified as unemployed –even though they were not working– as they continued to be linked to their company and received payments from the government to a large proportion of their salaries. Another example of the challenges involved in taking an accurate reading of these statistics is the situation affecting the over a million people who lost their jobs in the second quarter of the year. The vast majority of these could not be officially considered ‘unemployed’ as they could not actively seek employment during lockdown, which is a key requirement for the statistical definition of unemployment. Therefore, these workers were considered ‘inactive’, which meant that although the inactive population increased, conversely unemployed did not grow to the extent that may have been expected.
Considering the heterogeneity of the situations observed after the arrival of COVID-19, a broader understanding of the term ‘unemployed’ is required to account for people who are not working but statistically do not meet the requirements to be considered as ‘unemployed’. Therefore, in addition to the unemployed as defined by the criteria of the International Labour Organisation [ILO] (not in work but available and actively seeking employment), this group includes employed who had to stop doing their jobs for technical or economical reasons as well as furloughed workers. It also includes available inactive people, i.e. unemployed who cannot look for work and therefore do not meet the ILO criteria to be considered as such. Including these employed and inactive in the ‘extended unemployment figures’ enables calculating an extended unemployment rate, which draws a more accurate picture of the situation experienced by different groups in the labour market. This estimated rate grew in Spain from 16.4% towards the end of 2019 to 35.6% in the second quarter of 2020. The rate according to the ILO criteria for the same period went from 13.8% to 15.3%.


From the point of view of society and the labour market, the ‘available inactive’ population, i.e. those officially considered inactive because they do not meet the requirements to be in the labour market but wish to join it, is a matter of major concern. Every day spent in this situation makes them more vulnerable and may result in them being permanently excluded from the labour market.
The gender gap in the unemployment rate slightly decreased during the pandemic. In the second quarter of 2019, the unemployment rate for women was 3.3% higher than the one for men. By the second quarter of 2020, the gap had narrowed to 2.6%. However, this drop may not be interpreted as a relative improvement in female employment. Instead, as previously explained, it indicates that some unemployed were statistically classified as inactive, more of whom were women. The unemployment rate amongst the under 25s increased from 33% to 39.6%, showing a more significant relative increase than seen in the whole population.
The increase in the unemployment rate in the first quarter of 2020 was well widespread throughout Spain. The regions that had the highest unemployment rate in 2019, which were Andalusia (Andalucía), the Canary Islands (Canarias) and Castile–La Mancha (Castilla–La Mancha), continued to hold this position in 2020. The same evolution was observed in the unemployment rate amongst the under 25s.
Furlough Schemes

The labour market began to feel rapidly the impact of the pandemic short after 14 March 2020. The public administrations quickly took hefty measures to lessen the effects of lockdown for both companies and workers. One of the main priorities of Royal Decree Law 8/2020 of 17 March, on extraordinary urgent measures to reduce the economic and social impact of COVID-19, was to protect the productive and social fabric so that it could resume normal activity as soon as possible. One of the most important and effective mechanisms was Coronavirus Job Retention Scheme, officially called ‘Temporary Employment Regulation Scheme’, which is a furlough-type instrument which already existed in Spanish regulation but was adapted to fit the new scenario. This instrument allowed companies to temporarily suspend an employment contract or reduce its working hours whilst keeping the employment relationship. Whilst this Scheme was in force, workers received a payment from the government to compensate for the total or partial loss of their salary. Two new furlough schemes were set, i.e. one due to force majeure and the other due to objective reasons. Both were intended to prevent lay-offs linked to uncertainty and the drop in activity caused by lockdown. The intensity and duration of the health crisis forced the public administrations to lengthen this mechanism on several occasions, to the extent that it was still in force in June 2021.


Data registered by the National Public Employment Service for the months of May and June 2020 show that Furlough Schemes were predominantly used in the service sector, particularly in commerce and the food and beverage services. To a lesser extent, Furlough Schemes were also used in professional and administrative services, education, sports, culture, social services, manufacturing and construction. Restrictions and limitations being loosened and then lifted after lockdown and the gradual return to ‘new normal life’ from May 2020, led in all cases to a drop in uptakes by June 2020.
Data on companies using Furlough Schemes, as well as on employees who received unemployment benefits as a result of being affected by this mechanism, show that the vast majority were due to force majeure and job suspension in the second quarter of 2020, with far fewer being used for objective reasons or to allow partial unemployment. The maps show that Furlough Schemes were more commonly used in areas of Spain where the local economy is largely based on the service sector, in general, and the food and beverage services, in particular.
Unemployment, poverty and social protection


The first estimates of the impact of the pandemic on economy in Europe confirm that poverty rate is increasing in many states. In spite of the emergency measures put in force by the governments, the current situation is breeding a rise in income disparities between states and reducing the social and territorial cohesion of the continent. States in the south, and Spain in particular, have fewer jobs that may be carried out using home office, yet those who may work from home tend to be more qualified and have higher salaries than in other central European states. In addition, fewer medium and low-skilled jobs were deemed as being ‘essential’ in southern European states, suggesting that the impact of the pandemic on lower-income households was more significant than in other states.
Comparing the months of May 2019 and May 2020 reveals a remarkable rise in the amount of people claiming unemployment benefits throughout Spain, especially by those affected by furloughs (see the map on Beneficiaries of unemployment benefits). However, significant differences may be observed in the regional coverage rates (see the map on Coverage of unemployment benefits), which measure the ratio of beneficiaries of unemployment benefits to unemployed. The coverage of unemployment benefits increased in the northern and eastern regions, whilst it reduced in some southern regions, especially Extremadura and Andalusia (Andalucía).

The effects of the pandemic revealed more quickly and were more harmful for more vulnerable households, according to the quarterly data from the Labour Force Survey. Both the graph on the Evolution in the amount of households where all active members are unemployed and the graph on the Evolution in the amount of households with no income show that the second quarter of 2020 marked a clear change in trend with respect to the one observed since 2014.
This change in direction entails an increased risk of unemployment, which is much greater for those who live in vulnerable households. The poorest households saw their income drop by a third in the initial months of the pandemic, especially if their members came from ‘informal employment’. This caused a rapid rise in the amount of households living in severe poverty, especially amongst those with dependent minors. The percentage of households with no income, whether due to lack of work or to not having received benefits, increased by almost 20% from the last quarter of 2019 to the second quarter of 2020. However, it shall be pointed out that this rise was nearly double as much for households with dependent minors (37%). Therefore, the economic impact of lockdown seems to have been significantly more severe in households with dependent minors, the long-term consequences of which are an issue of major concern.
The ‘Regional Minimum Incomes’ granted by the regional public administrations were until June 2020 the only public policies designed to cover the risk of extreme poverty. For several decades, the geographical coverage of this benefit has been very heterogeneous. In average, these benefits reached 17% of households at risk of poverty throughout Spain in 2019. However, whilst in some regions, such as the Basque Country (Euskadi/País Vasco) and Navarre (Navarra), all households with income below the poverty line were covered, in others, such as Castile–La Mancha (Castilla–La Mancha) and Andalusia (Andalucía), this benefit reached under 10% of them. In addition to this regional inequality, the Spanish minimum income model suffered from a low protective capacity and minimal coverage. With the onset of the COVID-19 health crisis, new measures were put in place to protect households living in extreme poverty. Indirect support mechanisms were developed and the regulations were revised to prevent the withdrawal of basic utilities due to non-payment (electricity, gas, water and telecommunications). Electricity rate subsidies were extended to a wider range of social groups, and automatic moratoria on mortgage payments and various aids to vulnerable tenants were introduced. The main problem was the delay in granting them, which probably made them less effective. It is important to point out that these were emergency and needed transitory measures not intended to solve long-term structural problems.
A more substantial direct support scheme, the national Minimum Subsistence Income, was introduced during the pandemic as a permanent social protection instrument designed to reduce the high amount of households at risk of poverty. This scheme is intended to ensure that any household with an income below a minimum threshold (determined by its number of dependent adults and minors) may have its income supplemented with a benefit that allows to reach said threshold.
However, granting this benefit to the population for which it is intended is proving to be a slow and challenging process, making it difficult to assess the effectiveness of this policy. The initial results indicate that several Andalusian provinces concentrate the highest amount of national Minimum Subsistence Income beneficiaries, i.e. Cádiz, Seville (Sevilla), Granada, Almería and Jaén. However, analysing the percentage of households receiving benefits with an income below 40% of the median (i.e. those at risk of severe poverty), draws a very different picture. For example, in Castile and León (Castilla y León) and Navarre (Navarra), over 20% of potential beneficiaries received the benefit, whilst this figure was only 7% for Catalonia (Catalunya/Cataluña).
-
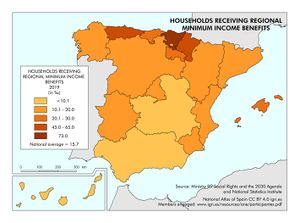 Map: Households receiving Regional Minimum Income benefits. 2019. Spain. PDF. Data. Interactive version.
 -
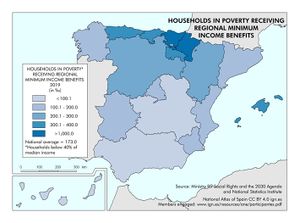 Map: Households in poverty receiving regional minimum income benefits. 2019. Spain. PDF. Data. Interactive version.
 -
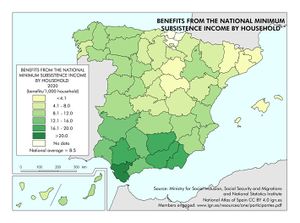 Map: Benefits from the National Minimum Subsistence Income by household. 2020. Spain. PDF. Data. Interactive version.
 -
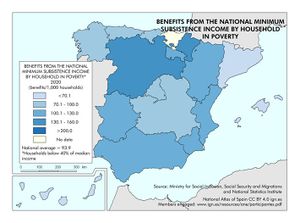 Map: Benefits from the National Minimum Subsistence Income by household in poverty. 2020. Spain. PDF. Data. Interactive version.


Co-authorship of the text in Spanish: Ana Arriba González de Durana, Olga Cantó Sánchez, Inmaculada Cebrián López and Gloria Moreno Raymundo. See the list of members engaged
You can download the complete publication The COVID-19 pandemic in Spain. First wave: from the first cases to the end of June 2020 in Libros Digitales del ANE site.