Mobility
The COVID-19 pandemic in Spain. First wave: from the first cases to the end of June 2020
Monographs from the National Atlas of Spain.
The impact and importance of transport in European societies support the need for an analysis on mobility in this publication. The transport of people, goods and information has seen exponential growth in recent decades due to increasingly globalised trade flows and changes to the logistics that channel them.
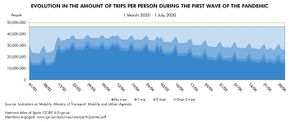
The need to supply materials to the industries and services demanded by the population entails high levels of mobility in Spain. The robust tourist industry, family and professional relationships, trips related to culture and sport as well as freight are just some of the factors that cause these high levels of mobility. The COVID-19 pandemic and the enactment of the state of alarm that led to a strict lockdown on 14 March 2020 caused a sudden interruption in the flow of people, and -to a lesser extent- goods. Only the very essential activities required to ensure critical supplies to the population were left out of the social and economic standstill in Spain in spring 2020. Hence, at the beginning of the so-called ‘temporary non-essential economic hibernation' from 30 March to 09 April 2020, nearly 60% of the population made no journeys at all, 5% made only one trip and 15% made two. Moreover, 43% of these journeys during lockdown were 0.5-2 km long trips whilst these short journeys accounted for just 35% of the total only one month earlier (Martos, 2020). It is remarkable how limitations on mobility increased social awareness of its importance and highlighted how difficult it is for citizens to give up mobility (Báguena, 2020).
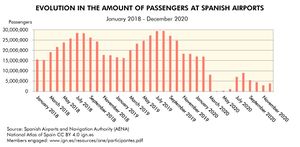
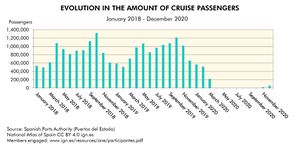
The impact of the pandemic on the different territories varied depending on the economic specialisation of each region. On a national and international scale, tourism and transport clearly fared worse than almost any other sector. In Spain, this impact resulted in a 70% year-on-year drop in air passenger traffic comparing 2019 and 2020 as well as in cruise ship traffic vanishing from sight.
This chapter is structured as follows: first, road transport is assessed. Second, the text delves into the changes in rail transport. It then analyses the impact on urban transport in major towns and metropolitan areas. The storyline goes afterwards on to sea transport. The text then focuses on the variations in air transport. And the last topic is devoted to mobility detected my mobile phones. The analysis on the different means of transport focuses on the changes in mobility during the first wave of the pandemic in spring 2020, when the population was under a strict lockdown, by comparing the figures from 2020 to the typical flows recorded from March to June 2019. All means of transport registered their sharpest drops in April and May 2020. By sections, passenger transport was much more affected than freight and registered a greater reduction in all means of transport (Martos, 2020). By means, air transport was the most impacted and is the one that is finding harder to recover normal figures. A large number of sources have been consulted in order to assess mobility and changes registered in the different means of transport.
You can download the complete publication The COVID-19 pandemic in Spain. First wave: from the first cases to the end of June 2020 in Libros Digitales del ANE site.


