Talk:Barcelona and its metropolitan area
The COVID-19 pandemic in Spain. First wave: from the first cases to the end of June 2020
Monographs from the National Atlas of Spain. New content
Thematic structure > The COVID-19 pandemic in Spain > Different spatial behaviours > Barcelona and its metropolitan area
COVID-19 was responsible for 74,853 infections and 12,596 deaths in Catalonia (Catalunya/Cataluña) from 26 February to 30 June 2020. 20,958 infections and 4,260 deaths out of the total occurred in the city of Barcelona. In other words, whilst the capital city is home to just 21% of the population in Catalonia (Catalunya/Cataluña), it accounted for 28% of infections and 34% of deaths. Demographers have pointed out that the impact of the pandemic was so severe as to increase mortality rates and reduce life expectancy. In addition, there were further impacts on health, including a decline in fertility rates and a sharp reduction in foreign migrations, amongst others (Esteve et al. 2021).
There were 3,339,279 inhabitants in 2020 in the Metropolitan Area of Barcelona, which comprises the city of Barcelona as well as some 35 towns around it. This means that 42% of the population in Catalonia (Catalunya/Cataluña) lives in an area that covers just 2% of the territory. Data for the Metropolitan Area of Barcelona allow approaching one of the issues repeatedly raised in scientific and citizen debates from the beginning of the health crisis, i.e. the influence of living conditions on the incidence of the pandemic. This section depicts this issue by assessing the relationship between the incidence of the pandemic and some of the most decisive aspects of mobility and social vulnerability.
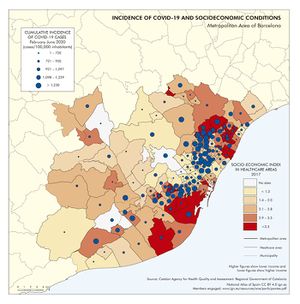
The map on the Incidence of COVID-19 and socioeconomic conditions shows the cumulative incidence of COVID-19 cases in the Metropolitan Area of Barcelona in relation to the socioeconomic index in healthcare areas. This map confirms the situation pointed out in May 2020 by the Catalan Agency for Health Quality and Assessment (AQuAS, 2020): first, the most vulnerable groups in socioeconomic terms show higher incidence and mortality rates than those with higher socioeconomic conditions; second, from a regional perspective, some of the healthcare areas to register higher incidence were those with lower socioeconomic conditions. However, a positive correlation by socioeconomic conditions could not be identified between incidence rates and mortality.
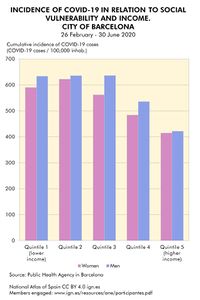
Data provided by the Public Health Agency in Barcelona confirm, in general, a clear relationship between the incidence of the pandemic and socioeconomic conditions. The population is grouped by income quintiles on the graph on the Incidence of COVID-19 in relation to social vulnerability and income, which shows that the first quintile (lower income) had a significantly higher incidence of infections than the fifth quintile (higher income), i.e. 42.3% in the case of women and 50.2% in the case of men. It is also worth of mention that a slightly lower incidence was to be observed in the first quintile in relation to the second and third ones. This could perhaps be attributed to the fact that most vulnerable population has less access to healthcare and therefore to testing and thus to statistics, whether for reasons of age or due to an irregular administrative situation (e.g. migrants having no resident or work permit for the European Union).
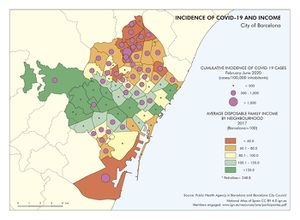
The map on the Incidence of COVID-19 and income shows the cumulative incidence of COVID-19 cases in relation to the average disposable family income in the 73 neighbourhoods in the city of Barcelona. This map shows that, generally speaking, lower-income neighbourhoods registered higher incidence rates. This relationship was also assessed and verified in the ten boroughs and in the tens of census sections in Barcelona with a high level of statistical significance (Baena-Díez et al. 2020; Marí-dell’Olmo et al. 2021).
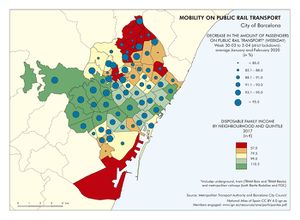
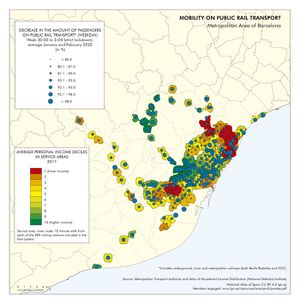
The uneven incidence of the pandemic amongst the different social groups may be explained by certain social conditions (e.g. employment, working conditions, housing, etc.) as well as by previous pathologies / comorbidities (e.g. obesity, diabetes and others). Different degrees of mobility reductions may also be a relevant explanatory factor. People with higher income tend to work in more flexible sectors that are able to implement home office. By contrast, lower-income groups are usually employed in manual jobs and fragile working environments and find more difficult to reduce mobility. This is also confirmed by mobility data on public rail transport in relation to the average income, which are displayed on the map together with the access stations (Checa et al. 2020).
The amount of people using public rail transport in the Metropolitan Area of Barcelona dropped sharply from February to June 2020, as depicted on the graph on the Evolution of mobility on public rail transport by income quintile. The decline began the week before the state of alarm and speeded up after 14 March 2020. The drop was particularly sharp and quick in areas where the disposable income was higher, whilst it was weaker in lower-income areas. Thus, in the third week of lockdown, the average amount of passengers at stations located in higher-income areas had reduced to 4.9% of the figures registered in the previous months (measured in average amount of tickets used). The census sections with the lowest income also registered a sharp reduction in the amount of passengers, yet not as deep, since figures were reduced to 14.3% of those registered in January and February 2020.
Neighbourhoods within the richest decile in the city of Barcelona reduced mobility to just 5.7% of the figures registered prior to the pandemic. By contrast, the use of rail transport (metropolitan railway, underground, tram...) fell to 13.8% of pre-pandemic figures in neighbourhoods within the poorest decile. In short, mobility stayed clearly higher in lower-income neighbourhoods than in higher-income ones throughout the first wave of the pandemic.
Co-authorship of the text in Spanish: Joan Checa Rius, Joan López Redondo, Jordi Martín Oriol y Oriol Nel·lo Colom. See the list of members engaged
- AGÈNCIA DE QUALITAT I AVALUACIÓ SANITÀRIES DE CATALUNYA (2020), ed.: Desigualtats socioeconòmiques en el nombre de casos i la mortalitat per COVID-19 a Catalunya. Barcelona, AQUAS. Available in: http://hdl.handle.net/11351/4934.
- BAENA-DÍEZ, J. M et al. (2020): «Impact of COVID-19 outbreak by income: hitting hardest the most deprived». Journal of Public Health, Volume 42, Issue 4, December 2020, pp. 698–703. Available in: https://doi.org/10.1093/pubmed/fdaa136
- CHECA, J et al. (2020): «Los que no pueden quedarse en casa: movilidad urbana y vulnerabilidad territorial en el área metropolitana de Barcelona durante la pandemia COVID-19», Boletín de la Asociación de Geógrafos Españoles, nº 87. Available in: https://doi.org/10.21138/bage.2999
- ESTEVE, A.; DOMINGO, A. y BLANES, A. (2021): L’impacte demogràfic de la COVID-19, un balanç provisional. En: BURGUEÑO, J. (coord.), La nova geografia de la Catalunya post-COVID. Barcelona. Societat Catalana de Geografia.
- MARÍ-DELL’OLMO, M. et al. (2021): «Socioeconomic Inequalities in COVID-19 in a European Urban Area: Two Waves, Two Patterns», International Journal of Environmental Research and Public Health, 18(3), 1256. Available in: https://doi.org/10.3390/ijerph18031256
You can download the complete publication The COVID-19 pandemic in Spain. First wave: from the first cases to the end of June 2020 in Libros Digitales del ANE site.
