Talk:Saragossa (Zaragoza)
The COVID-19 pandemic in Spain. First wave: from the first cases to the end of June 2020
Monographs from the National Atlas of Spain. New content
Thematic structure > The COVID-19 pandemic in Spain > Different spatial behaviours > Saragossa (Zaragoza)


The first wave of the COVID-19 pandemic in the city of Saragossa (Zaragoza) is assessed from a three-dimensional perspective in which the health, social and emotional scopes are taken into account.
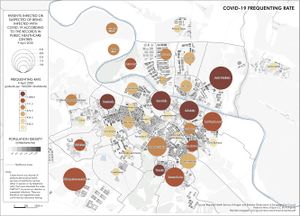
In terms of the health dimension, the different neighbourhoods in Saragossa (Zaragoza) were affected unevenly. Initially, the situation was assessed using the well known approach of counting registered COVID-19 cases and the rates of active cases and recovered patients. However, on top of this, the Regional Government of Aragón added the so-called ‘frequenting rate’, i.e. the number of patients infected or suspected of being infected with COVID-19 according to the records in public healthcare centres. Given that the capacity to carry out mass PCR testing was not yet available at that time, applying this second indicator provides a more detailed profile of the health situation. The data available are recordered by healthcare areas that approximately match neighbourhoods or sometimes smaller sections of the city. This allows highlighting internal differences amongst healthcare areas.
Two types of healthcare areas registered a higher frequenting rate. The first type were areas with a higher mobility; either internal mobility, within the municipality [this was the case of Valdespartera-Montecanal, Venecia and Avenida de Cataluña, where inhabitants go across the city every day for different purposes, such as work, many of them on public transport], or external mobility, with people travelling over the weekend to other regions or states/countries [for example, there is a direct flight from Saragossa (Zaragoza) to Bergamo in Lombardy/Lombardia (Italy), where infection rates during the first wave of the pandemic were extremely high]. In both cases, these are areas of intermediate socioeconomic level, like Bombarda, which also registered very high frequenting rates. The second type of healthcare areas to register high frequenting rates were those where lower socioeconomic layers of society live, some of which were severely affected during the first wave of the pandemic and suffer acute social vulnerability, such as San Pablo and Rebolería.
The social dimension looks at the sociodemographic and housing context in the city. This is shown on the map depicting the percentage of households in which five or more members live in homes with under 90 m2. Areas in red and orange point out higher figures (a higher percentage of households with these peculiarities), and those in green unveil the opposite situation. It may be concluded that citizens in some areas of the city, such as Delicias Sur, San Pablo and Las Fuentes Norte, were more vulnerable to COVID-19 infection due to their lower capacity for isolation within their homes and therefore due to a higher risk of infection within family relations. This indicator also suggests that socioeconomic factors, such as a more fragile labour environment or one that does not enable home office, put these citizens at higher risk of infection from outside family relations.
The emotional dimension was a relevant aspect that was particularly important during the first wave of the pandemic. Saragossa City Council was sensitive to this scope and used a survey to gauge citizens’ living conditions and emotional well-being during lockdown. It was answered by over 5,000 people.
The first question on the survey referred to employment. The majority answered that no changes were registered during lockdown in terms of being employed, especially in neighbourhoods with higher socioeconomic living standards, such as Romareda-Seminario and Madre Vedruna-Miraflores. By contrast, sectors like San Pablo, Delicias and Arrabal stood out for the high percentage of inhabitants that were either unemployed or furloughed.
The second question alluded to home office. Whilst this way of working was strongly implemented in some of the neighbourhoods with higher socioeconomic living standards, where teachers, professors, lawyers and similar professions are present, such as Romareda-Seminario, this possibility was not to be found in neighbourhoods with lower skilled professions, such as Las Fuentes-Norte, San José and Torrero-La Paz.
The third question was intended to gauge the emotional well-being of citizens during lockdown. Firstly, the dominance of yellow areas stands out, showing intermediate emotional conditions. However, there are some interesting nuances, such as the high percentage of positive emotional responses in certain areas of the city with high levels of social vulnerability (e.g. Delicias), what points out high levels of resilience.
Finally, the answers to the fourth question depict the general trend towards increased spending on television subscriptions during lockdown. Given that inhabitants in lower-income areas, such as Delicias and San Pablo, were less likely to be able to afford these television subscriptions, this question reveals itself to be an indirect indicator of social vulnerability.
-
 Map: Employment during lockdown. City of Saragossa (Zaragoza). 2020. Saragossa (Zaragoza).PDF. More information.
 -
 Map: Variation in home office during lockdown. City of Saragossa (Zaragoza). 2020. Saragossa (Zaragoza).PDF. More information.
 -
 Map: Emotional conditions during lockdown. City of Saragossa (Zaragoza). 2020. Saragossa (Zaragoza).PDF. More information.
 -
 Map: Variation in spending on television subscriptions during lockdown. City of Saragossa (Zaragoza). 2020. Saragossa (Zaragoza).PDF. More information.
You can download the complete publication The COVID-19 pandemic in Spain. First wave: from the first cases to the end of June 2020 in Libros Digitales del ANE site.