Economic indicators (COVID-19 monograph)
The COVID-19 pandemic in Spain. First wave: from the first cases to the end of June 2020
Monographs from the National Atlas of Spain.
Thematic structure > Social, economic and environmental effects > Economic indicators and productive sectors > Economic indicators
|
Companies deemed as being essential
|
The state of alarm enacted on 14 March 2020 ushered in a general lockdown and in the suspension of all non-essential economic activities. This decision had an immediate and distressing impact on economy. However, which activities were deemed as being ‘essential’?
Since the double recession back in 2008-2013, there has been increased interest in studying the economic activities deemed as being really ‘essential’ for the sustainable running of developed societies and the well-being of citizens. New terms, such as urban development sector and essential economy, have been coined to describe the economic sectors that supply basic goods and services to households and urban areas. These so-called ‘essential activities’ account for between a third and a half of employment in developed countries, and their critical nature makes them more resistant in times of economic downturn, falling income and growing unemployment.
The COVID-19 pandemic highlighted the relevance of this type of analysis. The state of alarm limited activity to a very specific set of essential activities that included the supply of energy, water and food; the processing sector; freight transport; information and communication services; financial services; business advice; public administration; healthcare; and social services (see the chart on Companies deemed as being essential.

The map on the percentage of Companies deemed as being essential in each municipality shows the relative importance of these economic activities, which account for 67.3% of companies and 74.1% of employed in Spain. However, this national average is widely exceeded in sparsely populated provinces, such as Lugo, Zamora, Palencia, Soria, Teruel, Huesca, Lleida, Cuenca and Almería, where companies deemed as being essential make up 75% of the business fabric. Segovia, Ávila, Salamanca and Jaén stand also above the national average with over 72% of companies considered essential. At the other end of the scale, the three Basque provinces, Alicante, Málaga, the Balearic Islands (Illes Balears), Ceuta and Melilla are to be observed, where less than 65% of companies are deemed as being essential.
Essential activities are well represented in regions and provinces where the agri-food and energy sectors play an important role as well as in territories with a large amount of workers in the public sector. The lower relative proportion of essential activities in more urban areas, clearly visible on the map, points out their more diversified economies, and also highlights the extent to which the city continues to rely on rural areas to meet its most fundamental needs.
Lockdown and halt of ‘non-essential activities’ were in force from 14 March 2020 to 28 April 2020. Towards the first days of May, the downscaling process began and non-essential activities could progressively open again, yet regarding some limitations up to 21 June 2020, when all limitations were lifted and the whole Spanish territory flowed into ‘new normal life’.


Economy plummeted by -21.6% during the second quarter of 2020 compared to the same period in 2019. However, the negative effects of the first wave of the pandemic also extended -albeit to a lesser extent- into the first and third quarters of the year, when contractions of -4.2% and -9.0% were registered. In short, the first wave of the pandemic caused a disruption in economic activity never seen before that affected good and service production, distribution and transportation, as well as remarkable effects on international trade (see the Annual Report from the Bank of Spain (2020) for further details).
The effects of the pandemic were clearly uneven. The extent to which a certain sector experienced the impact to a greater or lesser extent depended on the proportion of activity within the sector considered as being essential, on the specific limitations imposed by the public health authorities, on the reduced demand (especially for durable consumer goods and capital equipment) and on the impact of border closures on global economic circuits (logistics chains, air passenger traffic, etc.).
The agricultural sector, considered as being essential for its most part, did not shrink at all; on the contrary, it grew, especially during the second quarter of 2020 (+6.5%) which is the time when lockdown was in force.
At the other end of the scale, the construction sector was very severely affected as it was considered non-essential for its most part, and over and above that, many companies and families postponed investment and spending.
Industry and services also registered sharp drops due to the factors outlined above and to the peculiar mix of economic activities they encompass (see the graph on the Evolution in Gross Value Added).
The recovery of economic activity during the third quarter of 2020 was even more contrasting. Once limitations were lifted, the construction sector fared worse again. At the other end of the scale, industry was the sector that resumed regular activity faster during the third quarter of 2020 as national and international patterns of consumption revived and the global logistics chains creaked back into action.
The recovery was much slower in the service sector, weighed down by restrictions on mobility and limitations on opening to the public due to health reasons. These disturbances had significant effects on non-essential trade, cultural activities, and especially food and beverage services and leisure due to their high dependence on national and international tourism.
A closer look at the different areas of service sector activity shows that food and beverage services suffered the most due to the pandemic, with nearly 100% falls in the second quarter of 2020, when citizens were in lockdown and all businesses closed. Even during the recovery of the third-quarter of 2020, food and beverage services shrank by nearly 40%. By contrast, sectors that could implement home office, such as professional services or the information and communication sector, were better able to resist, as were other activities considered as being essential, such as transport and storage.
A similar pattern was observed amongst the different industrial activity fields. The areas considered as being essential, such as the production and distribution of energy and non-durable consumer good industries, with the food industry at its heart, put up well with recession as they were considered as being essential. Conversely, activities devoted to producing and selling durable consumer goods and capital equipment registered a more pronounced decline and a somewhat less sure-footed immediate recovery as the persistent uncertainty deterred families and companies from making decisions on spending and investment.
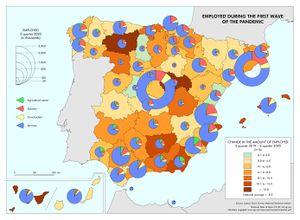
Due to these sectoral differences and to the uneven regional specialisations, the impact of the first wave of the pandemic on economy was unevenly distributed throughout the country. As the map on the Employed during the first wave of the pandemic shows, the provinces to see the most significant year-on-year contraction from 2019 to 2020, of over 10%, were those whose economies rely heavily on tourism and food and beverage services, such as Santa Cruz de Tenerife, the Balearic Islands (Illes Balears), Alicante and Almería, as well as those heavily reliant on construction, such as Guadalajara. By contrast, provinces with less dependence on services and a higher proportion of agricultural and agri-food industry businesses, such as Ávila, Palencia, Soria, Huesca and Lleida, or those with a highly dynamic ceramics industry, such as Castellón, suffered under a less severe impact on employment. Moreover, the change in the amount of employed was even slightly positive in some of these provinces, such as Ávila, Palencia and Castellón.
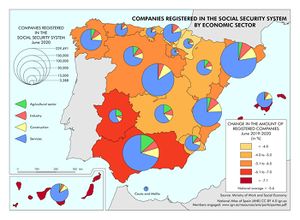
This fall in employment is related to the 5.6% drop in companies registered in the Social Security system. The most affected regions were the Balearic Islands (Illes Balears) [-10.6%], the Canary Islands (Canarias) [-7.7%], Andalusia (Andalucía) [-6.4%] and Extremadura [-6.3%], whilst the Basque Country (Euskadi/País Vasco) and Navarre (Navarra) lost just under 4% of companies. The reason for this contrast lies in the sectoral specialisation mentioned previously and the average size of the companies, with larger firms being able to draw on larger resources to withstand the downturn.
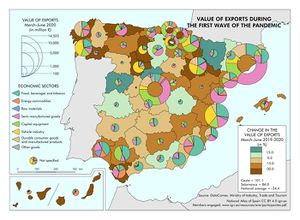
Finally, consideration must be given to the fall in exports, which dealt a severe blow to the economies of the main exporting Spanish regions. The crippling of global value chains, the limitations on transport and the drop in demand unleashed by the first wave of the pandemic reduced the value of Spanish exports by 24% compared to the same period of the previous year. The products most affected were energy commodities (-55.09%), vehicles (-44.73%) and manufactured consumer goods (-35.56%). By contrast, exports of food, beverages, tobacco and other merchandise increased slightly (by 5.01% and 3.62%).
-
 Map: Employed during the first wave of the pandemic. 2019-2020. Spain. PDF. Data. Interactive version.
 -
 Map: Companies registered in the Social Security System by economic sector. 2019-2020. Spain. PDF. Data.Interactive version.
 -
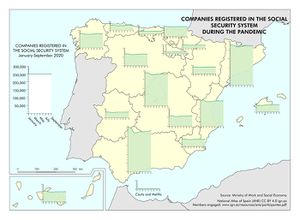 Map: Companies registered in Social Security System during the pandemic. 2020. Spain. PDF. Data. Interactive version.
 -
 Map: Value of exports during the first wave of the pandemic. 2019-2020. Spain. PDF. Data. Interactive version.


Again, the overall geographical impact was determined by sectoral specialisation. The most affected provinces were Santa Cruz de Tenerife, Las Palmas and Cádiz, due to their strong involvement in energy commodities; and Valladolid, Palencia, Araba/Álava and Saragossa (Zaragoza), due to the drop in vehicle exports. The provinces of Ourense and Corunna (A Coruña), for their part, were affected primarily by the drop in manufactured consumer goods. At the other end of the scale, exports increased from the provinces of Salamanca, Segovia, Huesca, Lleida, Cuenca, Cáceres and Granada, whose overall export volume is low but highly specialised in the food, tobacco and beverage sectors. Lastly, the provinces with the highest export volumes, such as Barcelona, Madrid and Valencia, benefited from more diversified export structures and relevant export of capital equipment and semi-manufactured goods, which lessened their downturns, keeping them around the national average.
Co-authorship of the text in Spanish: Juan Miguel Albertos Puebla, Julia Salom Carrasco and José Luis Sánchez Hernández. See the list of members engaged
- BANCO DE ESPAÑA (2021): Informe Anual 2020. Madrid, Banco de España.
- BENTHAM, J. et al. (2013): Manifesto for the Foundational Economy. Manchester, Centre for Research on Socio-Cultural Change.
- España. Real Decreto-ley 10/2020, de 29 de marzo, por el que se regula un permiso retribuido recuperable para las personas trabajadoras por cuenta ajena que no presten servicios esenciales, con el fin de reducir la movilidad de la población en el contexto de la lucha contra el COVID-19. Boletín Oficial del Estado nº 87 de 29 de marzo de 2020.
- FOUNDATIONAL ECONOMY COLLECTIVE (2020). What Comes after the Pandemic? A Ten-Point Platform for Foundational Renewal. Manchester, Foundational Economy Collective.
- SCHAFRAN, A. et al. (2018): «Replacing the services sector and three-sector theory: urbanization and control as economic sectors», Regional Studies nº 52 (12), pp. 1.708-1.719.
You can download the complete publication The COVID-19 pandemic in Spain. First wave: from the first cases to the end of June 2020 in Libros Digitales del ANE site.